Discharge
Discharge (or flow) refers to the volumetric amount of water carried by a body of water per unit time and is commonly expressed in units of cubic feet per second (cfs) or liters per second (lps). The degree to which discharge affects the structure of stream and river ecosystems cannot be overstated. Stream ecologists consider discharge a master variable, as varying rates of discharge directly affect the physical, chemical, and thermal attributes of aquatic ecosystems. High flow events have the ability to reshape the entire physical habitat of streams by repositioning large woody debris, sediment, and boulders within the active channel. Flow rates directly affect water quality, water temperature, microbial activity, nutrient cycling, and the life history of aquatic organisms, such as fish and macroinvertebrates.
Environmental factors such as precipitation, gradient (slope), available groundwater supply, soil type, and vegetation can all affect the magnitude of discharge within a stream or river. Anthropogenic, or human-caused, factors that affect discharge include dam installation, water diversion, urban development, groundwater withdrawals, or other land-use practices such as forestry or agriculture. Researchers monitor discharge in streams and rivers for a wide variety of applications that include forecasting extreme weather events (such as floods or droughts) or understanding changes in ecological parameters like water quality or biological habitat.
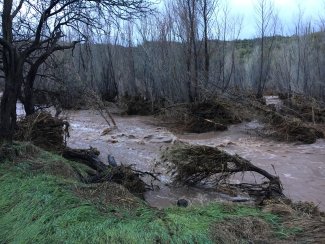
High flow events can affect water quality and alter the physical habitat within stream and river systems. The NEON Domain 14 aquatic site at Sycamore Creek (SYCA) in high-flow condition.
Sampling Design and Methods
The colocation of NEON hydrology and biogeochemistry measurements make it possible for researchers to make important calculations, such as nutrient fluxes, by combining concentrations with continuous flow data to determine the amount of nutrients flowing through a stream over time. Discharge is measured at all NEON stream and river sites as well as the inflow and outflow at Toolik Lake.
Discharge Measurement

Staff deploy remote controlled ARC-Boats at river sites while standing on the floodplain. This boat holds an ADCP inside of it and is driven back and forth across the channel to measure discharge.
Put simply, discharge equals the velocity of the water multiplied by the channel area (width times depth), also known as the velocity-area method. Discharge has been measured in a variety of ways dating back to 1889 when the United States Geologic Society (USGS) installed the first gauging station on the Rio Grande River in New Mexico. Since then, many discharge measurement techniques have arisen. A wading survey is one of the oldest methods and is still used today by many monitoring agencies, including NEON. During a wading survey, a field ecologist wades across the channel and measures the depth, velocity, and distance along a measurement cross-section with a wading rod, flowmeter, and meter tape. Conservative salt tracers can also be used to measure stream discharge by measuring the dilution of the salt solution after being added to the stream. An R package for working with salt-based discharge measurements can be found on the NEON GitHub repository.
In recent years, Acoustic Doppler Current Profilers (ADCPs) have allowed field ecologists to measure discharge with less uncertainty, and with greater safety because they are operated from the floodplain rather than within the channel. An ADCP uses sound to measure water velocity based on the Doppler Effect, a principal of physics discovered by Christian Johann Doppler in 1842. The ADCP is transported across the channel (via a float or boat) while the instrument makes continuous measurements of depth and velocity. The instrument bottom-tracks the stream/riverbed (or a Global Positioning System is used) in order to track the distance along the channel and calculate total width. Discharge is then calculated using the velocity-area method. ADCPs are deployed at NEON wadable stream sites via trimaran floats that are pulled across the channel using rope and pulley systems. At NEON river sites ADCPs are deployed across wide channels using remote-controlled boats.
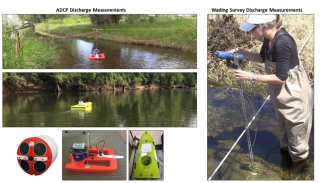
Discharge is measured at NEON aquatic sites using ADCP instrumentation and wading surveys. Left: ADCP deployment includes trimaran floats pulled across the channel with rope and pulleys at wadable stream sites and remote-controlled boats at river sites. Right: Discharge is measured using wading surveys during the low-flow regime at wadable stream sites.
![A velocity contour profile derived from an ADCP discharge measurement. Different colors of the profile represent different velocity magnitudes. [Profile produced using WinRiver II software (TRDI)]](/sites/default/files/styles/max_325x325/public/2020-12/Picture2_0.png?itok=Y4nSqm_y)
A velocity contour profile derived from an ADCP discharge measurement. Different colors of the profile represent different velocity magnitudes. [Profile produced using WinRiver II software (TRDI)]
Stage Measurement
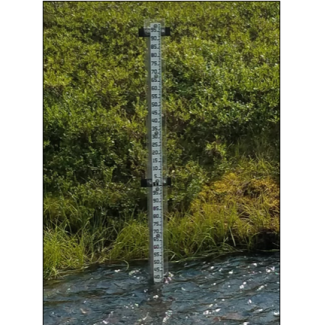
A staff gauge installed at a NEON aquatic site where water level is measured.
Water level, or stage, is strongly related to discharge. As such, a stage value is recorded during each discharge measurement based on the water level observed at a permanent staff gauge installed at the discharge cross-section. Staff gauges resemble long, graduated rulers that are surveyed relative to nearby permanent benchmarks with known reference elevations. A continuous record of surface water pressure is derived from sensors that continuously measure surface water pressure above the sensor. Pressure is converted to water height using a standard conversion equation, and water height values are related to staff gauge observations to transform continuous water height to continuous stage.
Calculating Continuous Discharge
At NEON wadable stream and river sites, multiple discharge measurements are conducted across a range of stage levels throughout the year in order to formulate stage-discharge rating curves for the measurement location. A rating equation is derived by plotting and fitting the empirical stage/discharge points, typically expressed as a power regression. Applying the rating equation to the continuous stage record (described above) produces a continuous record of discharge.
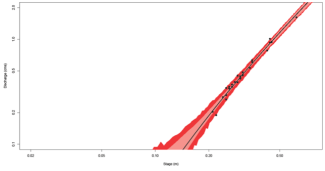
An example of a NEON stage-discharge rating curve. Black circles represent discrete discharge and stage measurements conducted throughout the year, the solid black line represents the best fit across the points, and the red bands represent the uncertainty associated with the continuous discharge estimate.
Data Products
All related discharge data are openly available through the NEON Data Portal. Related Data Products include:
- Discharge field collection (DP1.20048.001)
- Continuous discharge (DP4.00130.001)
- Stage-discharge rating curves (DP4.00133.001)
- Salt-based stream discharge (DP1.20193.001)
- Gauge height (DP1.20267.001)
- Elevation of surface water (DP1.20016.001)
- Elevation of groundwater (DP1.20100.001)

A Trimaran float equipped with an ADCP measuring discharge at the MCDI stream site.