Geomorphology

Geomorphology is the study of the shape and features of landforms, how they change over time, and the processes that transform them. It includes both topographic (land surface) and bathymetric (underwater) features. Streams, rivers, and lakes respond to local geology, physiography, and climate in a variety of ways, including morphological change.
Geomorphology data, combined with associated observational and instrument data, provides insights as to how surface and underwater landforms are changing and the impact of these changes on chemical and biological properties of the aquatic water bodies. By understanding the physical stability of aquatic systems and the degree in which they respond to various stressors (i.e. climate change, land use, or hydrologic controls such as dams or impoundments), researchers can assess land management impacts, evaluate the health of biotic habitat, and best predict how the system may respond to future events.

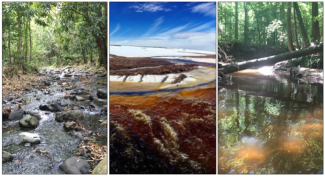
Stream morphology is highly variable in watersheds across the United States. Left to right: examples of different geomorphic conditions at NEON aquatic monitoring sites in Domain 04 Río Cupeyes (CUPE), Domain 19 Oksrukuyik Creek (OKSR), and Domain 08 Mayfield Creek (MAYF).
On a geologic timescale, such processes include the movement of tectonic plates, volcanic activity, and the movements of glaciers and ice sheets. On the shorter timescales of the 30-year NEON program, geomorphological processes include erosion of soil on riverbanks and lakeshores caused by the action of water or wind, changes in water levels resulting from precipitation or snowpack melt, deposition of sediment carried by streams and rivers, onshore and underwater vegetation growth, sudden geologic events such as landslides or earthquakes, extreme weather events, and the impact of human activities. To better understand how aquatic ecosystems are changing over time, NEON collects geomorphological data for streams, rivers, and lakes at aquatic field sites across the U.S.
Sampling Design and Methods
Stream Morphology
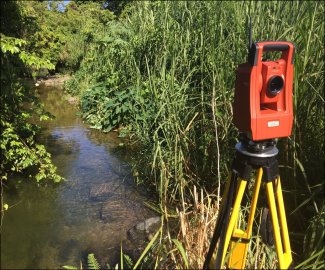
The NEON program conducts stream morphology surveys at wadeable stream sites once every five years. Survey data characterize bed topography, bank structure, stream wetted width, frequency and distribution of biological habitat units, sediment particle size distribution, and other features of interest including the location and extent of mid-channel bars, islands, large woody debris jams, and other geomorphic features. Each survey spans the full extent of the NEON aquatic monitoring reach (approximately 500-1,000 m in length). Survey data are collected using a high-resolution robotic total station, an instrument commonly used for land surveying. Permanent benchmarks are installed throughout the reach to relate surveys over time and tie survey data into real-world coordinates via global positioning system (GPS) instrumentation. Survey data are post-processed to generate data files and maps that provide a snapshot of fluvial characteristics at a particular point in time.

A total station mapping the reach of the GUIL aquatic site
Data include:
- Channel geometry
- Streambed elevation
- Channel slope
- Bankfull width
- Particle-size
- Distributions of sediment diameter
- Large woody debris counts
- Frequency of in-channel wood
- Morphologic maps
- Thalweg location
- Surface water level elevation
- Biological habitat unit distribution
- Location and dimension of geomorphic features such as large woody debris jams, mid-channel bars, islands, culverts, waterfalls, beaver dams and other features of interest
- Water quality sensor locations
- Cross-section measurement locations
The initial survey at each site establishes a baseline for stream topography and geomorphic features. Subsequent surveys demonstrate how stream topography and structure have changed over time. The stream morphology data product includes raw and post-processed survey data, maps, shapefiles, and metric tables that characterize geomorphic features within the aquatic reach boundaries. Additional surveys may be conducted within the five-year schedule following extreme weather events to assess the degree of geomorphic change. All data are openly available through the NEON Data Portal and an interactive map can be accessed on the Explore Field Sites page.

Example of a NEON stream morphology map via Google Earth at Domain 08 Mayfield Creek (MAYF).
Bathymetry

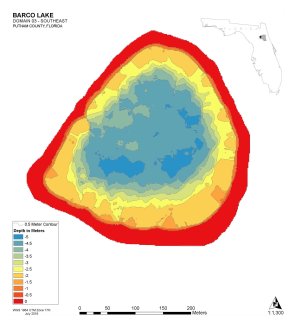
Bathymetry map of the Domain 03 lake site BARC
The NEON program conducts bathymetric surveys to characterize the shape of the bed underwater and habitat features at lake and river sites. Bathymetric maps are created with survey data derived via hydroacoustic instrumentation mounted off the side of a boat. A differential GPS locates each measurement in space and sonar collects data about the substrate and underwater habitat. At lake sites, the vessel is driven along the shoreline and in a path that covers the entire lake surface. At river sites the vessel is driven in a series of tracks covering the entire aquatic monitoring reach (approximately 1 km). Survey data are post-processed to generate data files and maps that provide a snapshot of bathymetric characteristics at a particular point in time.
Data include:
- Bathymetric maps, which include depth contours
- Underwater habitat maps, which include the distribution, abundance, and area cover of flora and woody debris
- Temporal and spatial metrics
- Volume and area
- Latitude, longitude, elevation above sea level, date, time
The initial survey at each site establishes a baseline for wetted width, depth, sediment type, and habitat diversity at river and lake sites. Subsequent surveys are conducted to monitor change in bathymetry and morphology over time. Surveys are completed annually at river sites and once every five years at lake sites. Additional surveys may be completed outside the regular schedule following extreme weather events to assess the degree of change within the underwater terrain and habitat. Surveys are scheduled during the summer biological sampling period and within the "peak greenness" window for the field site. All data are openly available through theNEON Data Portal and interactive maps can be accessed on the NEON Site Map page.
Data Products
- Stream morphology map (DP4.00131.001)
- Bathymetric and morphological maps (DP4.00132.001)