Soil Sensors

Soil temperature and moisture control a number of soil properties and processes, including root growth, soil respiration, microbial activity, and biogeochemical cycling rates, as well as influencing aboveground properties and processes. Soil respiration, derived from soil CO2 concentration data, can be used to partition ecosystem-level carbon exchange into above- and below-ground components. Soil heat flux is an important component of the terrestrial energy balance and necessary for interpreting tower-based surface-atmosphere exchange data. Time series of radiation and throughfall measurements near the soil surface can be directly related to phenological events (e.g., leaf out and litterfall). In addition, soil temperature and moisture are also relevant to making forecasts, such as flood risk or heat wave risk that can directly affect human wellbeing.
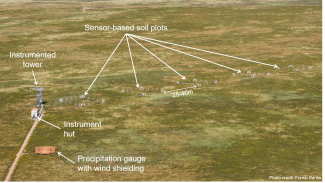
An aerial view of the sensor based soil plots at the CPER site showing a typical layout of a terrestrial site
Sampling Design and Methods
Soil temperature is measured using platinum resistance thermometers installed at various depths in the soil. Soil moisture is measured using capacitance sensors at most sites, while soil CO2 concentrations are measured using solid state sensors in housings that allow soil air to diffuse to the sensor. Soil heat flux is measured using a heat flux plate installed directly in the soil. Throughfall is measured using a tipping bucket installed near the soil surface with troughs used to increase the collection area. Skin temperature just above the soil surface is measured using an infrared temperature sensor, while net longwave radiation above the soil is measured using a net radiometer. Photosynthetically active radiation (PAR) at the soil surface is measured using a one-meter long diffuser connected to a photodiode.
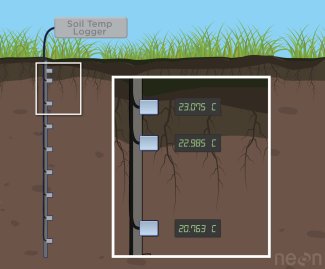
Soil temperature is measured at multiple depths typically down to 2 m deep.
NEON installs an array of five soil plots within or near the flux tower’s footprint and in the locally dominant (1 km2 scale) soil type of each terrestrial field site. Soil plots are typically spaced up to 40 m apart.
Vertical profiles of soil temperature (≤9 sensors per plot between 2-200 cm deep), moisture (≤8 sensors per plot between 6-200 cm deep), and CO2 concentration (3 sensors per plot between 2 and ~20 cm deep) are measured in each plot, with measurement depths based on soil depth, soil horizon thicknesses, and other soil properties. Where possible soil temperature and moisture measurements extend to 2 m deep, while soil CO2 concentration measurements are located in the surface soil (down to ~20 cm deep). Heat flux, the amount of thermal energy that moves through an area of soil in a unit of time, is measured near the soil surface in three of the soil plots. All soil sensor measurements are made at 0.1 Hz. In addition, photosynthetically active radiation, net longwave radiation, relative humidity, and throughfall precipitation measurements are made in a subset of soil plots near the soil surface. The radiation and humidity measurements are made at 1 Hz, while the throughfall measurement frequency varies depending on precipitation intensity.
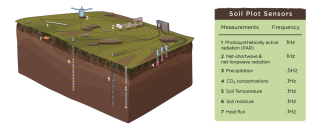
Schematic layout of a sensor-based soil plot. Note that some sensors are only present in a subset of soil plots.
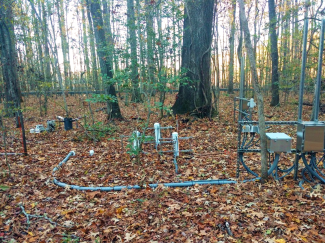
A sensor-based soil plot at the LENO site. Note that some sensors are only present in a subset of soil plots.
Basic soil data related products include:
- Soil CO2 concentration (DP1.00095.001)
- Soil temperature (DP1.00041.001)
- Soil water content and salinity (soil moisture) (DP1.00094.001)
- Soil heat flux (DP1.00040.001)
Temporally interpolated meteorological data collected at soil plots are created in collaboration with AmeriFlux, and are derived from a variety of data including measurements collected at the soil array.
- Temporally Interpolated Soil Temperature (DP2.00006.001)
- Temporally Interpolated Biological Temperature (DP2.00004.001)
- Temporally interpolated PAR-line (DP2.00016.001)
- Temporally Interpolated Shortwave and Longwave Radiation (Net radiometer) (DP2.00020.001)
In addition to automated data collection through the soil array, NEON field scientists collect soil samples for biogeochemical analysis and to archive. For more information, see Soils.