Lidar
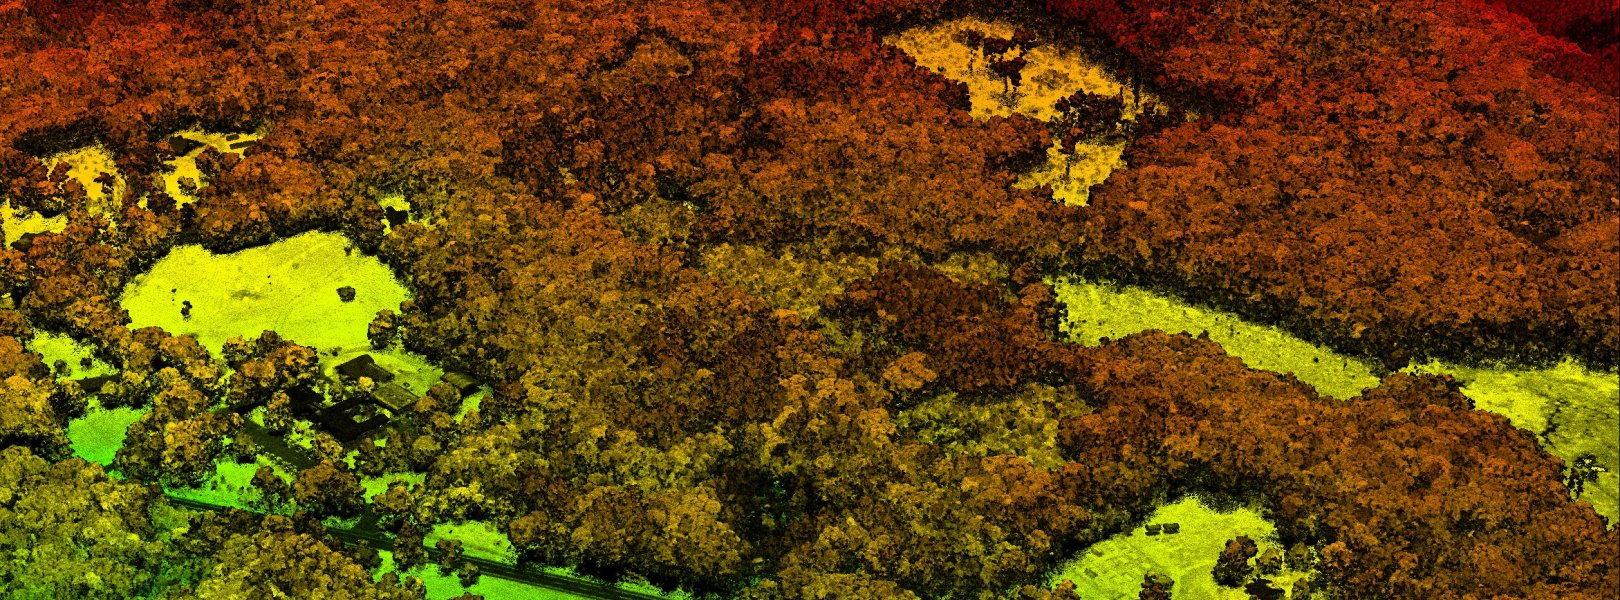
Scientists often need to characterize vegetation over large regions to answer research questions at the ecosystem or regional scale. To measure vegetation or other surface features at these larger scales, we need remote sensing methods that can take many measurements quickly, using airborne sensors. Lidar, or Light Detection And Ranging (sometimes also referred to as active laser scanning), is one remote sensing method that can be used to map ecosystem parameters, including vegetation height, density, and other characteristics across a region. Lidar directly measures the height and density of vegetation on the ground, making it an ideal tool for scientists studying vegetation over large areas.
When NEON conducts an airborne survey, the lidar system scans over a forested landscape and some of the light energy bounces off the top of the forest canopy. The return time of these laser pulses can be converted into a distance allowing us to map the height of the trees that make up the top canopy. Some of the light passes through the treetops and reflects back off the leaves, branches, and other structures within the canopy. In this way, lidar provides a detailed 3D picture of the forest structure. From these 3D forest structure lidar products, scientists and others can ask questions about forest production/decline over time. For additional information on the basics of lidar remote sensing and how it is used, see our data tutorial.
About Lidar
The lidar sensor, unlike the NEON imaging spectrometer (NIS) and camera, is an active sensor because it generates its own energy source. Active sensors are advantageous because they are not dependent on an external energy source, such as the sun, and can be flown at night or under cloud cover. The lidar's energy source is a highly collimated laser beam directed toward the ground and operated in the near-infrared at a wavelength of 1064 nm. Laser energy generated by the sensor is reflected from surface objects, and the returned laser energy is measured by the sensor. Based on the two-way travel time of the laser energy and the speed of light, a range to the point of reflection can be calculated. With knowledge of the precise position and orientation of the aircraft, the direction of the laser beam, and the range, the object that produced the reflection can be precisely geo-located in three dimensions.
How Does LiDAR Remote Sensing Work? Light Detection and Ranging
Two primary properties of the laser signal allow for detailed mapping of the ground surface. First, the laser can transmit and receive pulses at extremely fast rates, referred to as the PRF (pulse repetition frequency), to provide a detailed sampling of the terrain. NEON typically operates lidar sensors between 100,000 and 900,000 pulses per second (100-900 kHz). Second, each individual laser pulse can generate multiple returns. Landcover such as vegetation will typically reflect a portion of laser energy from the top of canopy, while residual energy can further reflect from the lower canopy, understory, and the ground beneath the vegetation. Therefore, lidar has a unique ability to characterize the three-dimensional structure of forests as well as information about the ground surface beneath vegetation.
Introduction to Light Detection and Ranging
The Airborne Observation Platform (AOP) currently operates different commercial lidar systems on the different payloads, summarized in Table 1. NEON's lidar sensors include an Optech Galaxy Prime and a Riegl Q780, and a new Riegl VQ-780 II-S will begin operating in 2025. Optech Gemini sensors were used for NEON Observatory collections from 2013-2020, while the Riegl Q780 began collecting data in 2018, and Optech Galaxy Prime started surveying in 2021. The lidar sensors are typically flown at an altitude of 1000 m above ground level (AGL). Adjacent flight lines are designed to overlap by 30% and have a full scan angle of at least 36°. The maximum PRF that could return reliable data from the Optech Geminis was 100 kHz, while the Riegl Q780 operates at up to 400 kHz (266 kHz effective), the Optech Galaxy operates at up to 1000 kHz, and the Riegl VQ-780 II-S operates at up to 2000 kHz (1333 kHz effective). The Riegl sensors incorporate a rotating scan mirror (as opposed to Optech's oscillating mirrors), so only 2/3 of the pulses are actually firing towards the ground, meaning the effective pulse rate is lower. At the lower PRFs (~100 kHz), 2-8 laser pulses per square meter will typically intercept the landscape, while the higher PRFs (>200 kHz) can record into the ~10s of pulses per square meter. If the ground cover produces multiple returns, a point density approaching 50+ points per square meter can be obtained. In areas where flight lines overlap, the number of pulses or points can double. For more information about the differences between NEON's lidar sensors and impacts to the data, please refer to the NEON FAQ question "What are the major differences between data acquired with NEON's different lidar sensors?"
| Lidar sensor | Optech Gemini | Riegl Q780 | Optech Galaxy Prime | Riegl VQ-780 II-S |
|---|---|---|---|---|
| Payload(s) | P1 & P2 | P3 | P1 | P2 |
| Years Flown | 2012-2020 | 2018 + | 2021 + | 2025 + |
| Laser Pulse Length (ns) | 10 | 3 | 3 | 3 |
| Beam Divergence (mRad) | 0.8 | 0.25 | 0.25 | 0.25 |
| Pulse Repetition Frequency (PRF, kHz) | 33-100 | up to 400* (up to 266) | 150-1000 | 270 - 2000* (180 - 1333) |
Data Products
The lidar sensors produce five of the 29 AOP data products (Table 2). The Level 1 lidar products are separated into discrete and waveform lidar products. Waveform lidar products can be differentiated from discrete lidar products by the method that the return laser energy is recorded (Figure 1). Full waveform lidar records the complete energy signature of the returned signal versus time (return waveform). NEON lidar sensors record the returned waveform at a 1 ns sampling interval. Discrete lidar only records times along the return waveform where targets have been identified. As a result, a full waveform may contain hundreds of samples that define the return energy signature, while the discrete may only identify a small number of targets (typically one to eight) from the same return waveform. The waveform lidar has benefits in providing additional information that may be ignored in the discrete lidar, however, requires high storage volumes and more advanced tools to analyze and visualize the data. The discrete lidar contains less information but has the benefit of a much smaller data volume, and a wider array of available tools for processing, analyzing, and visualizing the data. All Level 3 lidar products are raster images that are derived from the Level 1 discrete return point cloud.
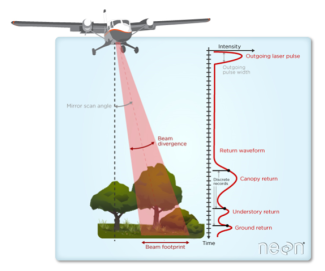
Figure 1 – Discrete and waveform lidar
| Product Name | Product Level | Product Number | ATBD Doc Number |
|---|---|---|---|
| LiDAR Slant Range Waveform | Level 1 | DP1.30001.001 | NEON.DOC.001293 |
| Discrete Return LiDAR Point Cloud | Level 1 | DP1.30003.001 | NEON.DOC.001292, NEON.DOC.001288 |
| Ecosystem Structure | Level 3 | DP3.30015.001 | NEON.DOC.002387 |
| Elevation – LiDAR | Level 3 | DP3.30024.001 | NEON.DOC.002390 |
| Slope and Aspect – LiDAR | Level 3 | DP3.30025.001 | NEON.DOC.003791 |
The outgoing laser pulse, often referred to as the 'T0' pulse, is not instantaneous and requires a small amount of time to reach peak energy and then another small amount of time for the laser to stop emitting light. The time required to rise and fall through peak energy is termed the pulse width. The pulse width influences the level of detail that can be retrieved from the return waveform and the number of returns that can be detected in the discrete data. In Figure 2, return waveforms from broadleaf trees have been simulated for four different T0 pulse widths. The 10 ns pulse width in black is representative of the Optech Gemini instrument and shows three distinct peaks. As the laser pulse width decreases, additional detail is identifiable. The green curve is representative of the Riegl LMS-Q780 instrument. The blue curve, displaying to most detail, represents a theoretical pulse width that may resolve individual small branches and clumps of leaves.
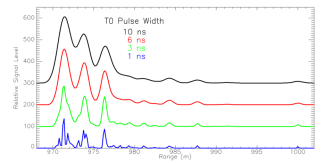
Figure 2 – Simulated waveforms of a broadleaf tree for various speeds of outgoing laser pulse widths with faster pulses showing more vegetation detail
Discrete Lidar - L1
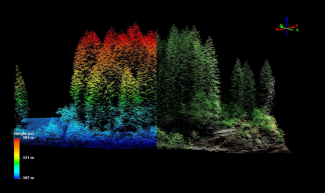
Figure 3 – Sample discrete lidar point cloud of a forest stand at WREF
The L1 discrete lidar data product consists of a lidar 'point cloud', which is a set of three 3D coordinates that represent the location of reflected laser energy (Figure 3). The point cloud is delivered in in two separate sets of files. The first is an 'Unclassified Pont Cloud' which is provided by flightline with no processing steps applied. These files are saved in the LAZ format which is a lossless compression of the LAS format. The LAZ format allows the discrete data to be stored at up to one-eighth the size of a LAS file, allowing the data to be more easily transferred electronically. Retrieving a LAS file from LAZ requires decompression with a free utility that can be found with the lastools software suite. Typical file size for single LAZ compressed discrete lidar flightline produced by NEON is between 300 MB and 1 GB. The second set of files available for the Level 1 discrete lidar product are the 'Classified Point Cloud'. These files are delivered as point clouds in LAZ format, but in 1 km by 1 km tiles as opposed to flightlines. A series of processing steps have been applied to classify the points into categories of 'ground', 'vegetation', 'building', 'noise' and 'unclassified'. Additionally, the files have been colorized with information obtained from spatially overlapping camera mosaic tiles (Figure 4). File sizes for the compressed tiles are typically around 100-250 MB.

Figure 4 – L1 Classified point cloud data product. Left: colorized point cloud, center: classification point cloud and right: elevation at PRIN.
Discrete Lidar - L3
All L3 lidar data products are raster images produced from the L1 discrete point cloud tiles. The point cloud is transitioned into raster products of elevation, topographic indices and a canopy height model (CHM) (Figure 5). The elevation products are broken into two sub-products including a Digital Terrain Model (DTM) and a Digital Surface Model (DSM). The DTM is generated from the point cloud using only points that have been classified as ground, resulting in a representation of only the terrain. The DSM uses all points in the point cloud which results in a map of the terrain as well as surface features. The topographic indices are calculated from the DTM and include both terrain slope and terrain aspect. The CHM can be thought of as a subtraction of the DTM from the DSM, which results in the height of surface features such as vegetation. The CHM is included in the 'Ecosystem Structure' L3 data product. All L3 raster images are created at a 1 m spatial resolution and are provided in an uncompressed raster geotiff format. A single tile of each product typically has a file size of about 4MB, and the volume for an entire site of tiles for a single product can range from 500 MB to 2 GB.
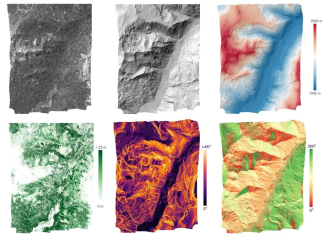
Figure 5 – L3 lidar products. Clockwise from top left: DSM hillshade map, DTM hillshade map, DTM hillshade map colored by elevation, terrain aspect, terrain slope, and canopy height model at Miriam Fire (MRMF), an assignable asset (NSF rapid response) flight to assess post-wildfire ecosystem structure in conjunction with the Burned Biomass FLUX (BBFLUX) group.
Waveform Lidar
Currently, NEON produces one waveform product - LiDAR slant range waveform (DP1.30001.001). This product provides the outgoing laser pulse signal, geolocation and timing information for each returning laser pulse, and the return waveform signal. Waveform lidar data are stored in the PulseWaves format. Within the Pulsewaves file format the data are stored in two files, a PLS file and a WVS file. The PLS file stores metadata and geolocation information for each outgoing and returned laser pulse, while the WVS file contains the outgoing and return recorded signals. For delivery, the files are compressed to files named PLZ and WVZ. A free decompression utility can be used to decompress the PLZ and WVZ files to PLS and WVS. Figure 6 shows an example of the signals stored in the waveform product for a single laser pulse from the Optech Gemini instrument. The plot on the left shows the outgoing 'T0' pulse which provides a record of the shape and relative intensity of the emitted laser pulse. The PulseWaves format stores timing information for an 'Anchor' point, which is typically marked at the peak of the outgoing pulse. An arbitrary 'Target' point is defined along the laser beam direction at a pre-defined offset from the 'Anchor.' The 'Anchor' and 'Target' are used to calculate the geolocation of each return laser pulse. Due to limits in data recording rates and the large volume of waveform lidar data, only sections of the waveform that have a signal above a pre-defined threshold are recorded. In the example shown in the right side panel of Figure 6, the first return segment was likely reflected from vegetation, and the second segment with the high intensity peak is likely the ground. A gap occurs between the two segments because any material between the canopy and ground did not reflect sufficient energy to be recorded.
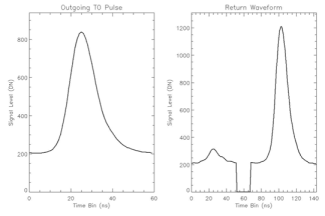
Figure 6 - Plots of the outgoing pulse shape (left) and corresponding return waveform (right) for a single laser pulse
Data Quality
Calibration Flights
A series of calibration flights are conducted at the beginning and end of each flight season to determine processing parameters used throughout the season and to ensure that the lidar data products meet NEON's accuracy requirements. Calibration flights are repeated at the end of the flight season to confirm that the sensor calibration has remained stable throughout the season. The lidar calibration flights are summarized in Table 3 and described below. Data from the calibration flights are not made available through the data portal but can be delivered upon request.
| Calibration Flight | Purpose(s) | Document Name |
|---|---|---|
| Boresight | Solve for boresight angles. Solve for GNSS-IMU lever armsNIS and Camera Geolocation (Camera Models) | N/A |
| Nominal Runway | Vertical absolute accuracy assessment | CTR_AOP_DQ_LidarVerticalAccuracy |
| Headquarters | Horizontal absolute accuracy assessment | CTR_AOP_DQ_LidarHorizontalAccuracy |
Boresight Calibration Flight
The boresight calibration flight consists of a series of flight lines flown at different altitudes and directions over an area with an abundance of planar surfaces such as an urban area with slanted rooftops. NEON typically conducts the boresight flights over Greeley, Colorado with a set of lines flown at 500 m, 1000 m, 1500-1600 m AGL flown in N-S, E-W, and NW-SE directions (Figure 7).
The boresight flight provides two functions for lidar processing: 1) it solves for the lidar boresight angular offset between the lidar sensor head and IMU (inertial measurement unit) and, 2) it determines the translational distance between the GNSS (Global Navigation Satellite System) antenna and IMU (referred to as lever arms). The boresight angles are determined in three dimensions (roll, pitch, yaw), and are solved through an iterative adjustment which calculates their best-fit through a minimization of coordinate differences of surface features in overlapping regions of flight lines. The GNSS-IMU lever arm values are used to translate the position of the GNSS antenna to the IMU. The lever arm translations are also determined through an iterative adjustment process.
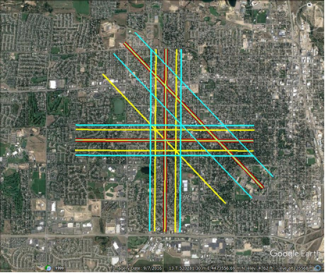
Figure 7- LiDAR Boresight flight lines collected over Greeley Colorado. Red lines are flown at 1500m AGL, yellow lines at 1000m AGL, and blue lines at 500m AGL.
Nominal Runway Vertical Accuracy Assessment
The Nominal Runway flight consists of a series of lines flown over the Boulder airport runway, at varying Pulse Repetition Frequencies (PRFs) and power levels of the lidar sensors (Figure 8). The elevations derived from the lidar data collected with different acquisition parameters are compared to ground control points to confirm that the absolute vertical accuracy of the sensor meets our requirement of less than 0.15 m root mean square error (RMSE). Ground control points were measured using high accuracy differential GPS observations, and are interpolated to generate a validation surface. The elevation of the validation surface is compared to the elevations of lidar point that is reflected from the runway. Summary statistics of the vertical difference between each lidar point are calculated and include the RMSE, mean bias, and standard deviation for each acquisition parameter. Additionally, for the Optech sensors that contain an oscillating scanning mirror, we calculate the intensity difference between opposing scan directions. If the percent difference between the intensities in the opposite directions is >20%, this indicates a possible misalignment in the optics of the sensor that requires re-calibration.
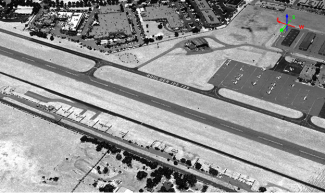
Figure 8. Example lidar image from the Nominal Runway calibration flight over the Boulder Runway.
Headquarters Horizontal Accuracy Assessment
The Headquarters (HQ) flight consists of two perpendicular lines over the NEON HQ building. The HQ flight is used to confirm the absolute horizontal accuracy of the lidar sensor meets our requirement of less than 0.58 m RMSE at 1000 m AGL. The horizontal accuracy is determined by identifying when subsequent lidar returns 'jump' from the ground surface to the HQ building roof. The minimum horizontal distance between the HQ building edge and the horizontal coordinate of the point where the 'jump' first occurs represents the horizontal error in the sensor. The NEON HQ building was surveyed with a total station survey to create the control object of building edges.
Quality Assurance Metrics
A number of quality assurance (QA) metrics are reported with the lidar data products and included in QA documents that are delivered with the data. These QA metrics are summarized in Table 4.
| QA Metric | Description | Notes |
|---|---|---|
| Relative Elevation Difference (Map and Histogram) | Difference in elevation of ground points in overlapping strips | Measures the relative vertical error between lines. Mean of relative error should be near zero in a well-calibrated instrument. Presence of heavy vegetation cover of high slopes can introduce higher than expected differences. |
| Point Density (Ground & All) | Number of points per square meter acquired for ground points and all lidar points | Higher point density is typically more desirable and NEON aims to meet 1 pulse per square meter. The Riegl Q780 sensor can obtain a higher point density than Optech Gemini due to higher operational PRFs. Ground point density may be low in areas with high vegetation density because fewer pulses reach the true ground and return sufficient energy to the sensor. |
| Longest Triangular Edge (Ground and All Lidar Points) | Longest edge of the TIN triangle used in creation of a raster cell in DSM, which utilizes all available LiDAR points | Shorter edges signify less interpolation was required in the transition of point cloud to raster. Long edges are common in ground-only points for areas of high vegetation density. In dense vegetation fewer pulses reach the ground with sufficient energy to initiate a return signal. |
| Vertical and Horizontal Uncertainty Propagation | Simulated uncertainty based of instrument subsystems at standard confidence (68%) following algorithm outlined in Goulden and Hopkinson (2010) | This will highlight areas that have higher uncertainty due to trajectory error, range error, scan angle error, and beam divergence. |
| Absolute error | In a subset of the sites, high accuracy GPS validation points are collected and compared to the lidar data to provide detail about the absolute vertical error. | This provides validation that absolute error is < 0.15 m at select sites. GPS data is collected using rapid static procedures. |
Data Processing Workflow
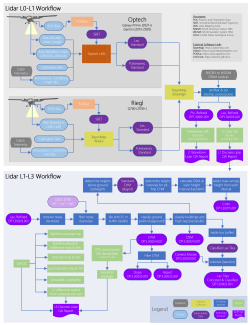
Summary diagram of Lidar L0-L3 Data Product algorithms