Imaging Spectrometer
To answer ecological and Earth science questions at landscape scales and larger, scientists need data collected at those scales. Remote sensing - flying automated sensors such as cameras, spectrometers, and others on drones, aircraft, or satellites - is an excellent solution for quickly gathering many high-quality measurements over large areas that would be impossible to cover from the ground. Hyperspectral sensors, also called imaging spectrometers, collect measurements of sunlight reflected from the Earth's surface in hundreds of narrow (typically 5 to 10 nm) spectral channels covering a range of wavelengths from 380 to 2500 nm, far beyond the range of the human eye. Because every chemically unique substance has a unique reflectance spectrum, scientists can use the data collected by imaging spectrometers to identify plant species and communities, map vegetation health, detect disease or invasive species, and map drought and its impacts. Hyperspectral remote sensing data is a powerful tool for scientists and land managers to map and answer questions about a landscape.
About the spectrometer
The NEON imaging spectrometer (NIS) is a passive remote sensing instrument that measures reflected solar energy from the landscape. Imaging spectroscopy is analogous to a common camera, except that energy reflected from objects and captured by the camera is measured from a wide region of the electromagnetic spectrum (380 to 2500 nm) in narrow bands (5 nm), while a normal camera captures reflected energy in only the visible portion of the spectrum (380 to 700 nm) in wide bands corresponding to the Blue, Green, and Red wavelength regions. Because light can interact with matter in distinctive patterns, the detailed return energy signatures acquired through imaging spectroscopy can be used to identify composition and observe internal processes of imaged objects. For the NEON program, the primary interest is how light interacts with vegetation (Figure 1). Reflected solar energy can reveal details about plant productivity and health such as photosynthetic capacity, water content, and nutrient content and cycling. For example, it is well known that photosynthetically active vegetation will effectively reflect energy in near-infrared (NIR) wavelength region while absorbing energy in the red wavelength region (Figure 1). Over the lifetime of the NEON Observatory, the reflectance derived from NIS measurements will provide valuable information on how plant communities and health are changing due to short- and long-term shifts in the environment.
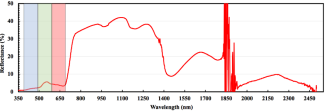
Figure 1 - Live vegetation reflectance curve
The NIS design is based on Next Generation Airborne Visible/Infrared Imaging Spectrometers (AVIRISng), which was developed under the Next-Generation Imaging Spectrometer (NGIS) program at NASA's Jet Propulsion Laboratory (JPL). The NIS uses a Mercury Cadmium Telluride focal plane array (FPA) operating in a vacuum evacuated optics chamber cooled to 140ºK. The NIS focal plane array (FPA) is a 2D array of 480 by 640 sensing elements in the spectral and spatial directions, respectively. However, a subset of sensing elements on the perimeter of the FPA are used for calibration purposes, resulting in approximately 426 spectral and 598 spatial useable sensing elements for development of NEON's data products. The FPA was developed to the requirements for high performance airborne remote sensing and provides high signal-to-noise ratio, spatial and spectral uniformity, and broad spectral coverage.
Individual sensing elements of the FPA record incoming solar radiation as a raw signal in Digital Numbers (DNs) with 14 bits. The DNs are converted to at-sensor radiance by applying calibration parameters, which translate to physical units of W/m2/sr/nm. At-sensor radiance is dependent on the strength of incoming solar radiation, which can vary based on ground cover composition and topography, sensor position, solar position, and atmospheric scattering effects due to presence of water vapor or aerosols. A reflectance measurement, which is the ratio of reflected to total incoming solar radiation and is independent of external conditions, is more desirable because it allows consistency between measurements for identifying change. At-sensor radiance is converted to reflectance through an atmospheric correction algorithm that calculates wavelength-dependent reflected energy by accounting for topography, sensor positions, solar positions, and atmospheric scattering.
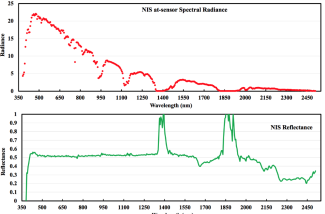
Figure 2 – Example of NIS at-sensor Spectral Radiance over a calibration tarp and the associated reflectance
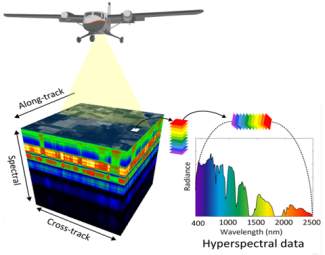
Figure 3 - Collection of a data cube of NIS data
The NIS measures radiant energy in the visible through shortwave infrared (SWIR) spectral region, covering 380 to 2510 nm. The spectral region is subset into 426 bands, each with a spectral resolution of ~5 nm and a full width half max (FWHM) of ~7.5 nm. Figure 2 shows an example of the at-sensor spectral radiance and associated reflectance measured by the NIS over a calibration target acquired during a test flight. As shown in Figure 2, the values for reflectance are unstable in the water absorption bands near 1450 nm and 1950 nm where the corresponding at-sensor radiance signal is near zero. The NIS has a 1 mRad instantaneous field-of-view (IFOV) at nadir, providing ground sampling resolution of 1 m at typical flight altitude of 1000 m above ground level (AGL). The integration time for the NIS is 100 milliseconds, so a row of contiguous imaged pixels is acquired at 100 Hz. Because the flight speeds are typically around 100 knots (50 m/s), the landscape will be oversampled as a line of 1 m pixels will be imaged every 0.5 m. AOP flightlines measure between 5 and 20 km in length and are about 600 min width at the nominal flight altitude of 1000 m AGL.
NEON Imaging Spectrometer (NIS) Specifications
| NIS Summary |
|---|
| Configuration: Pushbroom |
| Focal Plane Type : Teledyne TCM6604A |
| Focal Plane Material: Mercury Cadmium Telluride (HgCdTe) Detectors |
| Spectral Pixels: 480 rows, approximately 425 used |
| Spatial Pixels: 640 columns, approximately 598 used |
| Spectral Range: 380 – 2510 nm |
| Spectral Resolution: 7.5 nm FWHM, 5 nm Sampling |
| Radiometric Resolution : 14 bits |
| Total FOV : 34° |
| IFOV: 1 mRad |
Data Quality
Calibration Flights
A series of calibration flights are conducted before and after each flight season to verify the functionality of the NIS. Calibration flight data is not available on the portal, but can be provided on request. Each NIS is spectrally and radiometrically calibrated every winter before the flight season using a NIST-traceable light source in the NEON AOP calibration lab. To verify lab-determined calibration parameters and verify radiometric accuracy, a vicarious calibration flight is conducted. Vicarious calibration flights are conducted over known, well-characterized calibration tarps at 48% and 3% reflectance, which are validated against ground truth data acquired simultaneously with a field spectrometer (Figure 4a,4b). The vicarious calibration flights are typically conducted at Table Mountain near Boulder, CO, but have also been conducted at Railroad Valley, NV, which is also a Landsat calibration site. The AOP has also collected data over calibration tarps during several science collections. These include the SJER collection in 2013, the OSBS collection in 2014, the GRSM and ORNL collections in 2015, the SERC collection in 2016, the STEI collection in 2016, the PUUM collection in 2019, and the PUUM collection in 2020. All of the science flight where tarps were collected also have associated ASD data, except for the 2019 and 2020 PUUM collections.
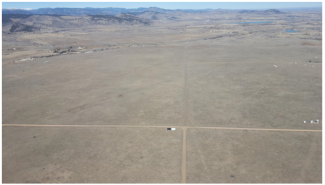
Figure 4a - Routine Vicarious Calibration Flight over Table Mountain, Boulder, CO showing two calibration tarps
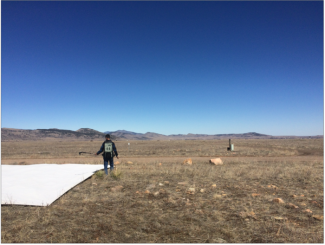
Figure 4b - Field spectrometer measurements of calibration tarps during a Routine Vicarious Calibration Flight over Table Mountain, Boulder, CO
Boresight geometric calibration flights are flown to create and validate a camera pointing model of the FPA. The camera pointing model includes angular offsets between the IMU (Inertial Measurement Unit) and the FPA (termed boresight angles), as well as geometric parameters of the sensor optics. The pointing model fully describes the viewing geometry for each individual sensing element of the FPA and is required for rigorous orthorectification of NIS observations. Accurate determination of the camera pointing model is required to ensure the NIS meets its relative accuracy requirement of 1.5 m against the lidar observations. Boresight calibration flights are conducted in Greely, CO because identifiable features readily available in urban areas are required for model generation.
Wiggle timing test flights are flown to measure and validate the accuracy of the timing signal in the NIS. The high data rate of NIS observations (100 Hz) necessitates an accurate timing signal to relate the NIS measurements to the positioning and orientation information provided by the GPS and IMU. The wiggle timing test collects NIS measurements over the Boulder runway while the aircraft is purposefully rolled to the port and starboard sides. If an inaccuracy exists in the timing signal, the runway will not appear straight and will meander as the aircraft rolls. If this issue exists, systematic timing corrections are tested until the resulting image of the runway is straight.
Weather
Data quality of the NIS measurements is primarily affected by local weather conditions. During atmospheric correction, scattering effects of water vapor and aerosols in the atmosphere are modeled to predict accurate surface reflectance. Modelling can be effective in the absence of cloud cover, but cannot be done accurately in the presence of clouds. To maximize the opportunity for collecting NIS data in acceptable weather conditions, historical weather conditions at each site are analyzed to predict the minimum deployment time required to collect the site in acceptable weather conditions (see flight scheduling page).
Due to its significant effect on the uncertainty measurements, the weather is communicated in a variety of locations. During flights, the airborne sensor operators record an estimate of total cloud cover in three categories: 1) 0-10% cloud cover, 2) 10-50% cloud cover, 3) \>50% cloud cover, which are labelled as Green, Yellow, and Red respectively. The observed weather classifications are stored in the HDF5 flightline files as attributes and converted into a weather quality image that represent different weather conditions among pixels in the mosaic tiles (Figure 5). Weather information is also communicated through a series of KMLs (Keyhole Markup Language) that represent each flightline, viewable in Google Earth (Figure 5), that are colored by the observed weather conditions. Finally, a table summarizing the flightlines acquired each day with the associated observed weather conditions is included in the L2 QAQC documents provided with data product downloads.
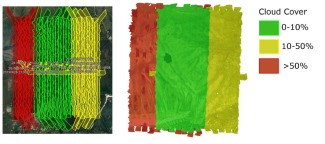
Figure 5 - 2019 HEAL collection showing spatial weather quality metadata. Left: flightline KMLs colored by observed weather conditions in Google Earth, right: Weather conditions used in pixels selected for final mosaic.
Calibration Drift
Routine verification of the radiometric and spectral stability of the NIS is achieved through the on-board calibration (OBC) system and mercury lamp (Hg) collections respectively. The OBC system records a set of data before and after each flightline. The OBC dataset includes a dark collect (no signal), a bright broadband light source, a dim broadband light source, and a narrow band laser. The dark collect is used to determine the noise floor of the sensor and will contribute to downstream processing of data products. The remaining OBC data are only used as comparison against pre-season lab data to determine whether the instrument calibration is drifting. The comparisons against the lab calibration can be found in a quality assurance (QA) document that is delivered with the L1 products. The mercury lamp collection is conducted at least once per domain. The mercury lamp is placed beneath the opening of the NIS in the airport hangar while the NIS is collecting data. The mercury lamp data are used to verify whether or not the spectral calibration of the sensor is drifting.
Data Product Assessments
The quality of final data products is assessed through the generation of maps which can be visually assessed, along with the associated histograms. The visual maps are used to identify gaps in that data, anomalous data values, or issues in the orthorectification. The histograms are used to verify that the data lie within known upper and lower bounds of the individual data products. For example, it is known that the Normalized Difference Vegetation Index (NDVI) equation forces values to lie between negative one and one. Plotting the NDVI data into a histogram allows quick verification that the data falls within the known limits. Because some of the data products do not have mathematical limits, generally observed limits have been identified and the histograms are compared against these limits.
Data Products
The NIS produces 21 of the 29 NEON AOP data products. A listing of the products derived from the NIS, along with the associated data product number and Algorithm Theoretical Basis Document (ATBD) are summarized in Table 1. The NIS data products are divided into product levels labelled as Level 1, Level 2, and Level 3.
Level 1
- Spectrometer Orthorectified at-Sensor Radiance (DP1.30008.001)
- Spectrometer Orthorectified Surface Directional Reflectance (DP1.30006.001)
Level 2
- Canopy Nitrogen (DP2.30018.001)
- Canopy Water Content (DP2.30019.001)
- Canopy Xanthophyll Cycle (DP2.30020.001)
- Canopy Lignin (DP2.30022.001)
- Vegetation Indices - Spectrometer (DP2.30026.001)
- Albedo - Spectrometer (DP2.30011.001)
- LAI - Spectrometer (DP2.30012.001)
- fPAR - Spectrometer (DP2.30014.001)
- Total Biomass Map - Spectrometer (DP2.30016.001)
Level 3
- Spectrometer Orthorectified Surface Directional Reflectance Mosaic (DP3.30006.001)
- Albedo - Spectrometer (DP3.30011.001)
- LAI - Spectrometer (DP3.30012.001)
- fPAR - Spectrometer (DP3.30014.001)
- Total Biomass Map - Spectrometer (DP3.30016.001)
- Canopy Nitrogen (DP3.30018.001)
- Canopy Water Content (DP3.30019.001)
- Canopy Xanthophyll Cycle (DP3.30020.001)
- Canopy Lignin (DP3.30022.001)
- Vegetation Indices - Spectrometer (DP3.30026.001)
Level 1 (L1) products include at-sensor radiance and surface reflectance which are distributed by flightline. The image data is georeferenced to the ITRF00 datum and projected into the appropriate UTM zone, and provided at 1 m spatial resolution. Both the radiance and reflectance image data are stored in an HDF5 file format that includes extensive metadata and data quality information. The HDF5 format was selected because of the flexibility it allows in storing associated metadata. However, the flexibility in the format inhibits storage of the data in a standardized structure. As a result, the HDF5 files cannot be read by standard geospatial software packages without a dedicated reader. Furthermore, specialized readers must be developed for accessing the data within common programming languages such as R or Python. Sample code for reading the HDF5 files can be found here. Individual flight lines of at-sensor radiance data are approximately 15 GB, while reflectance data is approximately 6 GB, although total file size can vary with the length of the flightline.
Level 2 (L2) products are derived from the L1 surface reflectance. Therefore, they are produced at the same spatial resolution (1 m), datum and map projection as the Level 1 products. The L2 products include a suite of spectral indices designed to strategically combine bands to highlight vegetation characteristics such as photosynthetic activity or water content. For example, NDVI (normalized difference vegetation index) is a well-known and commonly used vegetation index which combines information from the NIR and Red regions to estimate vegetative greenness and can be used as a proxy for plant health. The L2 products also include fPAR (fraction of photosynthetically active radiation) and LAI (leaf area index), products further derived from vegetation indices. Additionally, a surface Albedo product that estimates the integrated reflectance of all the NIS bands into a single value is also provided. All L2 products are distributed by flightline in a GeoTIFF (gtiff) format. Currently, all vegetation indices, water indices, fPAR, and LAI are delivered with associated simulated error images. Individual gtiff flightlines of L2 products will be approximately 50MB, although size can vary depending on the length of flightlines.
Level 3 (L3) products include all L1 and L2 products, excluding at-sensor radiance, and are distributed as 1 km x 1 km tiles instead of flightlines. Tiles are created by making a full mosaic of all the data and sub-setting the 1 km x 1 km tiles. The tiles are designed so their boundaries are set to even 1000 m UTM coordinate intervals. During the mosaic generation, the algorithm preferentially selects pixels that were collected under the best weather conditions in regions with multiple potential pixels due to flightline overlap. If weather conditions were equivalent, pixels acquired nearest to nadir of the image acquisition are selected. Generally, this will correspond to pixels that are nearest to the center of the flightline. The tiles are created at the same spatial resolution (1 m) as the L1 and L2 products are in delivered in gtiff format, with the exception of the surface reflectance, which is delivered in HDF5. Individual reflectance HDF5 tiles will be approximately 500 MB, while individual gtiff tiles will be approximately 4 MB.