Aquatic Organisms

Aquatic organisms are sensitive to changes in their environment and are good indicators of freshwater ecosystem health. NEON collects data that characterizes a suite of aquatic communities at 34 freshwater aquatic field sites (24 streams, 3 rivers, and 7 lakes). Aquatic organismal sampling is designed to occur during three seasonal periods (spring, summer, and fall). As part of NEON’s continental-scale open access platform, the aquatic organismal sampling is complemented by measurements of aquatic biogeochemistry, hydrology, morphology, and continuous sensor measurements.
Aquatic Microbes
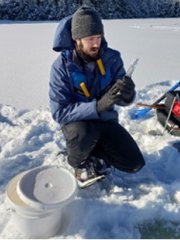
Microbes are the most abundant organisms on earth, present in virtually every environment. Aquatic microbes—including bacteria, fungi and protozoa—are abundant in all aquatic systems and play foundational roles in aquatic ecosystems, including capturing the sun’s energy through photosynthesis, releasing nutrients stored in organic matter through decomposition, and serving as a food source for tiny organisms at the base of the food chain. The microorganisms found in lakes, streams and rivers recycle nutrients such as nitrogen, phosphorus and carbon into usable forms for aquatic plants. Microbial communities are essential to the overall health and productivity of aquatic ecosystems. Microbe samples are collected from surface water in streams, rivers, and lakes, and benthic microbe samples are collected in streams across the NEON network.

Periphyton, Phytoplankton, and Aquatic Plants
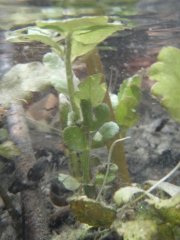
Periphyton, phytoplankton, and aquatic plants (vascular and non-vascular), bryophytes, lichens, and macroalgae, along with microbes, form the base of the food web in aquatic systems. Environmental factors such as flooding, scouring, wave activity, water level, light attenuation, and nutrient availability have strong effects on the algal and aquatic plant communities. Light quantity and quality, water depth, wave activity, current velocity, and flow regime are the most important environmental factors affecting these communities. Monitoring primary producer communities can also provide important data on invasive species and changes in nutrient loads, toxicity, and land-cover in watersheds. Plant communities act as refugia a for other organisms such as invertebrates and fish, and substrate for algae.

Macroinvertebrates and Zooplankton
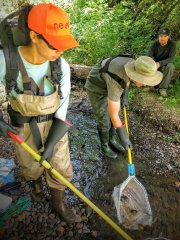
Aquatic macroinvertebrates and zooplankton are diverse and ubiquitous groups of organisms. Because of their presence in nearly all bodies of freshwater, invertebrates are excellent study organisms to address questions of biodiversity. Aquatic macroinvertebrates and zooplankton are easily sampled, common in all but the most polluted waters, and strongly affected by water quality. They are a significant food source for higher trophic levels (e.g., fish) and are highly sensitive to environmental change. As such, macroinvertebrates and zooplankton are good indicators of ecosystem health. Invertebrate communities are collected using quantitative methods in NEON stream, river, and lake sites.

Fish
Freshwater fish species use a broad range of habitats and life history strategies. Fish are relatively long lived, and often the top consumer in fresh water ecosystems. Collecting fish community data can provide early indicator information on the changing health of an aquatic ecosystem. For these reasons NEON uses standardized, quantitative methods to collect fish data at NEON aquatic sites. NEON fish sampling data can be used to understand ecosystem change and act as an indicator of ecological integrity.

Spatial Design
Aquatic environments can be partitioned by type of habitat, with organisms inhabiting different habitat types based on their life history and morphological characteristics. For example, in riffles with fast-moving water, organisms, including algae and macroinvertebrates, often have adaptations that allow then to adhere to the stream bottom. In streams, riffles, runs, and pools are the most common habitats. In lakes and rivers, habitats include littoral (nearshore) or pelagic (deep water). In addition, organisms can be living in the benthos (sediment-water interface) or in the water column.
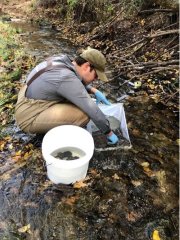
Most NEON aquatic organismal sampling represents a patch of benthos (sediment-water interface) or portion of the water column within the 1 km permitted wadeable stream or river, or within a lake basin. In wadeable streams, samples are collected in the 2 most common types of habitat, as determined by morphology surveys. In lakes and rivers, pelagic samples are collected along with littoral samples. Samples collected in the water column, such as phytoplankton and zooplankton, are collected near the inlet, outlet, and buoy (deepest) sampling locations, with buoy locations accompanied by temperature profile and secchi data. Each sample contains multiple individuals. In most cases, the exact location (latitude and longitude) of each the sample is not tracked recorded as it is intended to represent the overall habitat.
Temporal Design
Aquatic organismal sampling takes place during three, month-long bouts, each year to capture the presence, diversity, and abundance of multiple species and enable data users to correlate multiple data products. The range of dates are determined based on historical data for each site including streamflow, ice on/off days, the accumulation of degree days, weather, and riparian phenology.
Sampling occurs at or near base-flow in streams, during ice-off conditions in all aquatic sites, and will not occur during or directly following a flood in the stream or under ice in a lake. In the event of a flood, researchers will hold sampling for five days to allow the sediments to settle before sampling.
Sample Bout 1: Spring
- As an early-season date, this bout represents a period of rapid biomass accumulation after winter, typically after ice-off (where applicable) and prior to leaf out.
- Bout 1 commences as temperature and light levels begin to increase, promoting an increase in primary productivity and/or a change in riparian phenology
- In high elevation and/or high latitudes, bout 1 only begins after ice-off
Sample Bout 2: Summer
- This bout targets low flows, high light (mid-summer), and maximum greenness of vegetation and riparian phenology
Sample Bout 3: Autumn
- This bout represents the late growing season at each site during leaf-fall.
- Bout 3 commences when light levels begin to decrease and temperatures cool, which results in water column shifts (e.g. decreased lake stratifications, biological community shifts, etc.)
| Data product | Spring (Bout 1) | Summer (Bout 2) | Fall (Bout 3) |
|---|---|---|---|
|
Benthic microbe marker genes |
✔ |
✔ |
✔ |
|
Benthic microbe metagenomics |
|
✔ |
|
|
Periphyton and phytoplankton collection |
✔ |
✔ |
✔ |
|
Aquatic plant point counts |
✔ |
✔ |
✔ |
|
Aquatic plant clip harvest |
|
✔ |
|
|
Macroinvertebrate collection |
✔ |
✔ |
✔ |
|
Macroinvertebrate metabarcoding |
Archive only |
✔ |
Archive only |
|
Zooplankton collection |
✔ |
✔ |
✔ |
|
Zooplankton metabarcoding |
Archive only |
✔ |
Archive only |
|
Fish collection |
✔ |
|
✔ |
|
Riparian vegetation |
|
✔ |
|
*Surface water microbes are collected on a monthly or bi-monthly schedule
Using NEON to Solve Key Questions in Aquatic Organismal Research
NEON collection methods are carefully selected to provide standardized data sets across aquatic field sites and that are compatible with existing historical data and/or data collected by other large-scale networks.
Here is a selection of research questions that could be addressed with NEON organismal data:
- How are aquatic microbial communities impacted by the effects of human activities including agricultural runoff, industrial pollutants and sewage treatment?
- How do changes in microbial communities affect algae, aquatic plant and fish communities (and vice versa)?
- How do aquatic organismal communities change with changing abiotic drivers (integrating aquatic instrumentation and biogeochemistry)?
- How do aquatic organismal communities respond to environmental disturbances, such as hurricanes and droughts? Are they resilient or resistant to disturbance?
- Calculate plant and microalgae percent cover in wadeable streams. How does percent cover change over time and with changing water levels or temperature?
- Are plant communities stable over time at a site? Do some species become more dominant with changing water level or temperature? Are invasive species taking hold in any of the NEON aquatic sites?
- Is it possible to predict the vulnerability of fish communities to non-native species invasion?
- How do predator-prey ratios and interactions change across the NEON network?