Tutorial
What is a CHM, DSM and DTM? About Gridded, Raster LiDAR Data
Authors: Leah A. Wasser
Last Updated: Feb 6, 2024
LiDAR Point Clouds
Each point in a LiDAR dataset has a X, Y, Z value and other attributes. The points may be located anywhere in space are not aligned within any particular grid.

LiDAR point clouds are typically available in a .las file format. The .las file format is a compressed format that can better handle the millions of points that are often associated with LiDAR data point clouds.
Common LiDAR Data Products
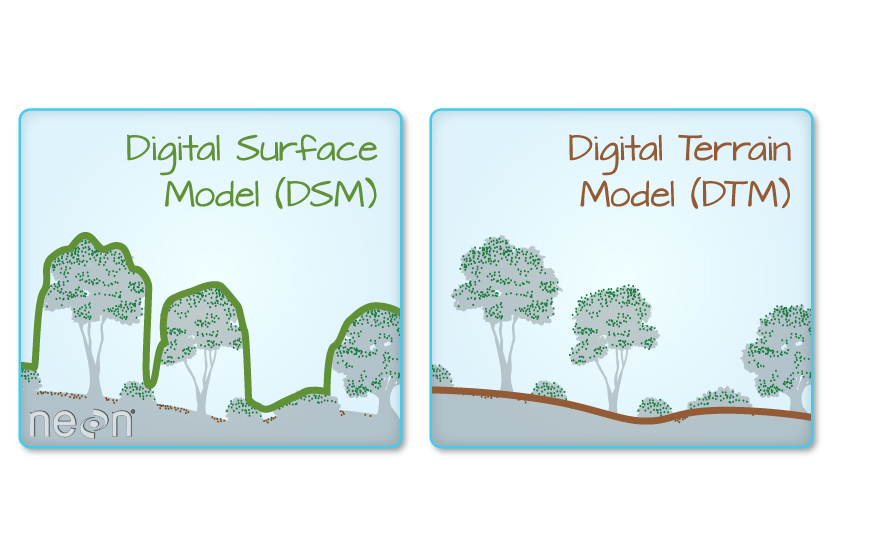
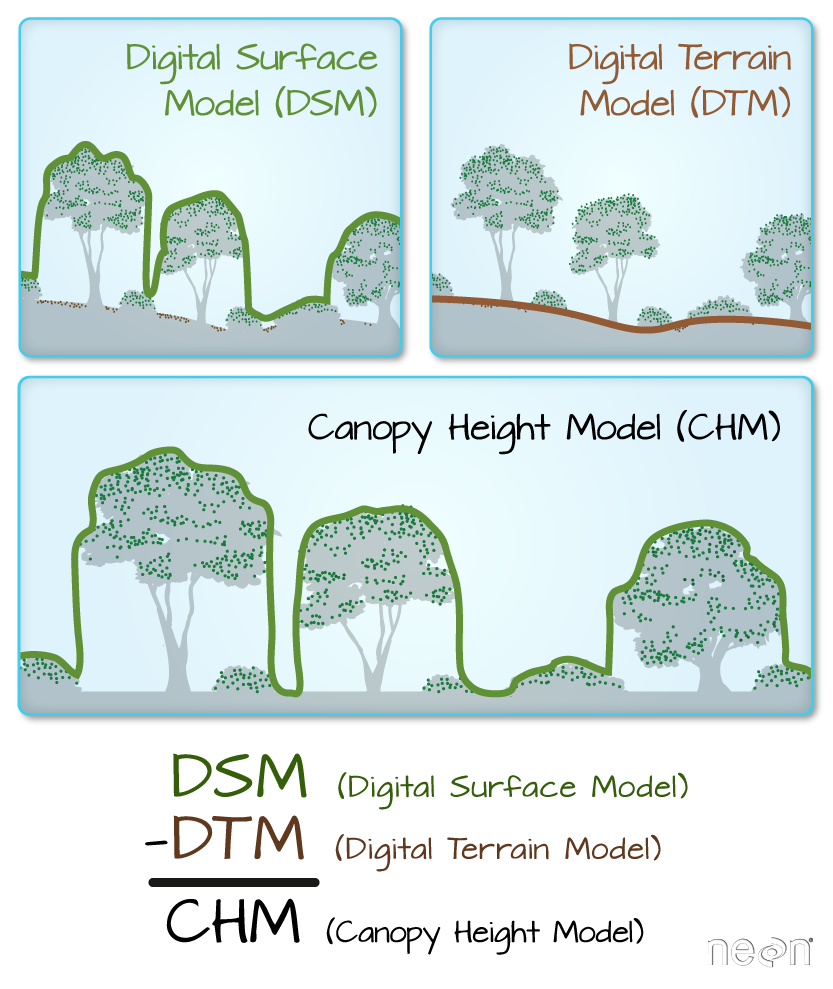
The Digital Terrain Model (DTM) product represents the elevation of the ground, while the Digital Surface Model (DSM) product represents the elevation of the tallest surfaces at that point. Imagine draping a sheet over the canopy of a forest, the Digital Elevation Model (DEM) contours with the heights of the trees where there are trees but the elevation of the ground when there is a clearing in the forest.
The Canopy height model represents the difference between a Digital Terrain Model and a Digital Surface Model (DSM - DTM = CHM) and gives you the height of the objects (in a forest, the trees) that are on the surface of the earth.
Free Point Cloud Viewers for LiDAR Point Clouds
For more on viewing LiDAR point cloud data using the Plas.io online viewer, see our tutorial Plas.io: Free Online Data Viz to Explore LiDAR Data.
Check out our Structural Diversity tutorial for another useful LiDAR point cloud viewer available through RStudio, Calculating Forest Structural Diversity Metrics from NEON LiDAR Data
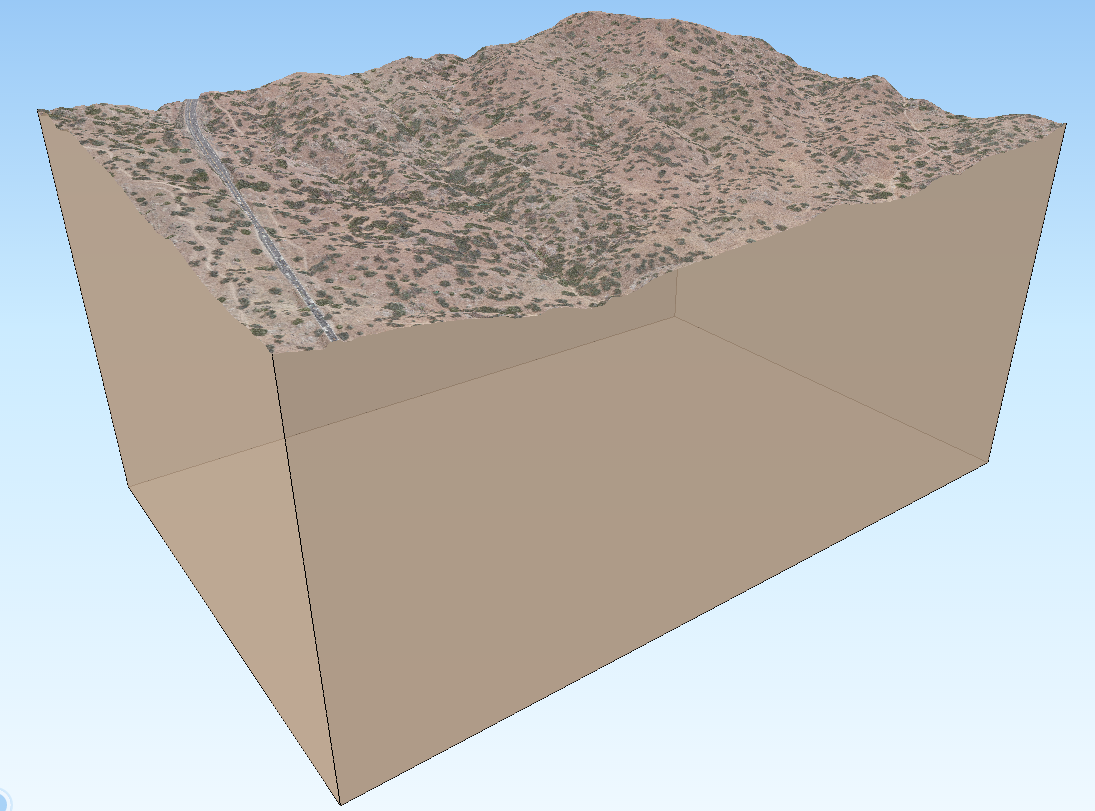
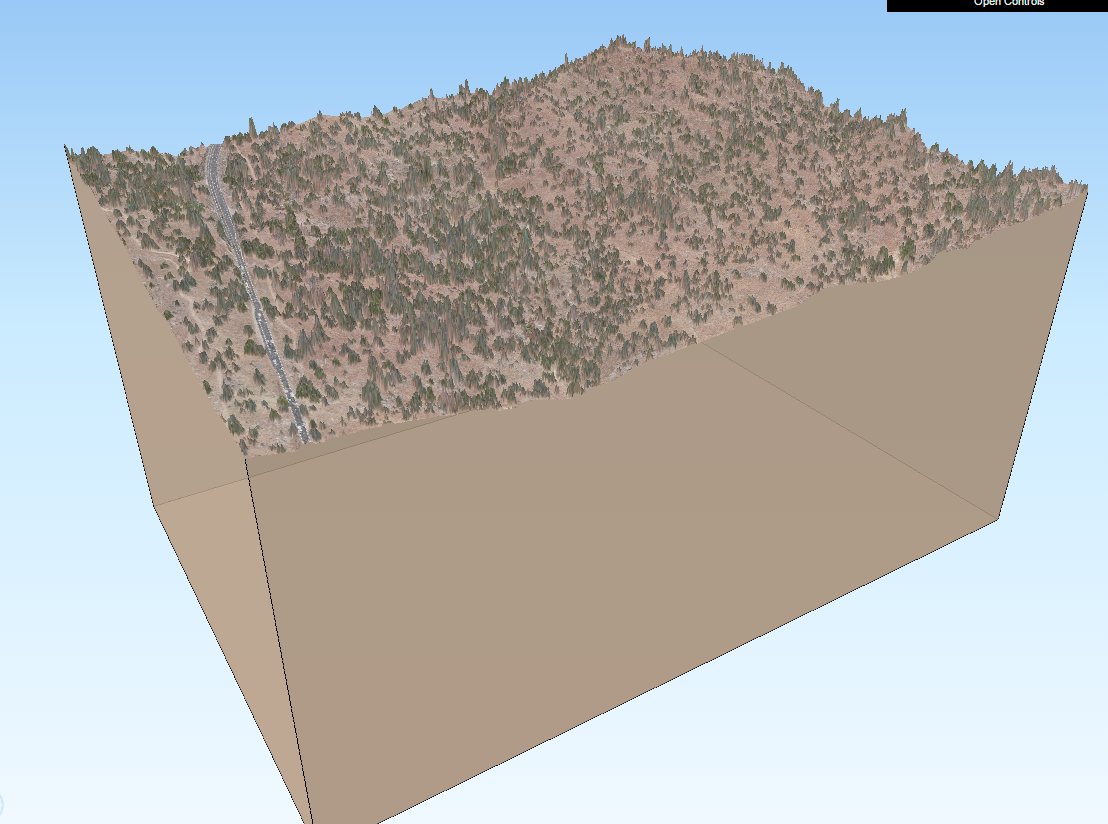
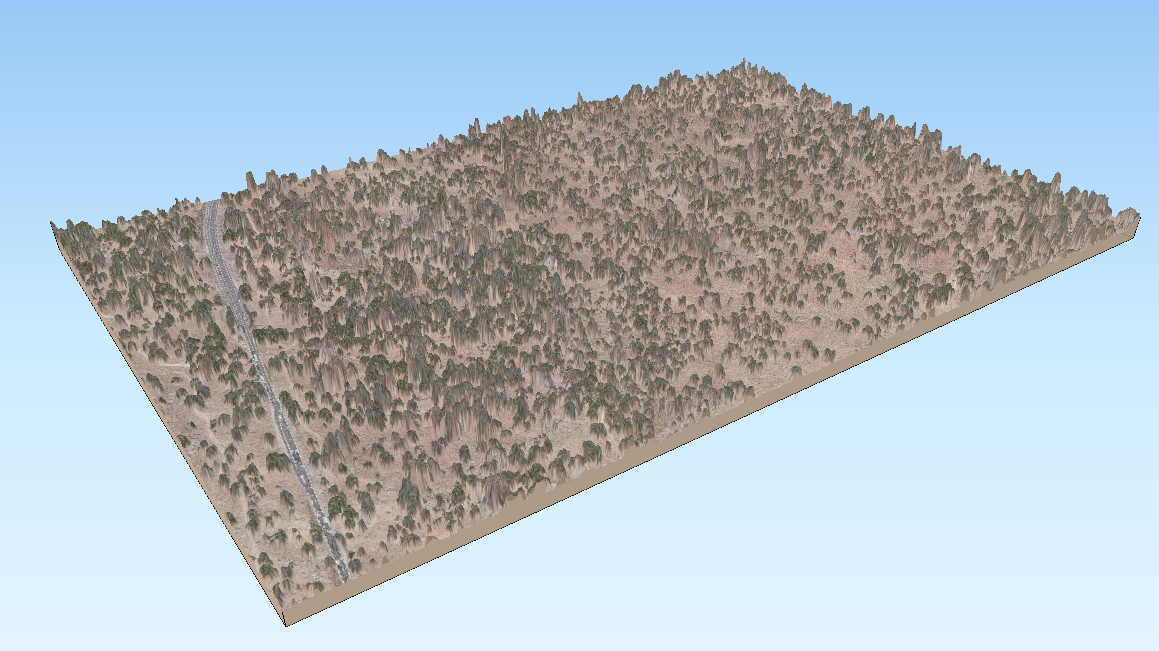
3D Models of NEON Site: SJER (San Joaquin Experimental Range)
Click on the images to view interactive 3D models of San Joaquin Experimental Range site.
 |
 |
 |
Gridded, or Raster, LiDAR Data Products
LiDAR data products are most often worked within a gridded or raster data format. A raster file is a regular grid of cells, all of which are the same size.
A few notes about rasters:
- Each cell is called a pixel.
- And each pixel represents an area on the ground.
- The resolution of the raster represents the area that each pixel represents on the ground. So, for instance if the raster is 1 m resolution, that simple means that each pixel represents a 1m by 1m area on the ground.
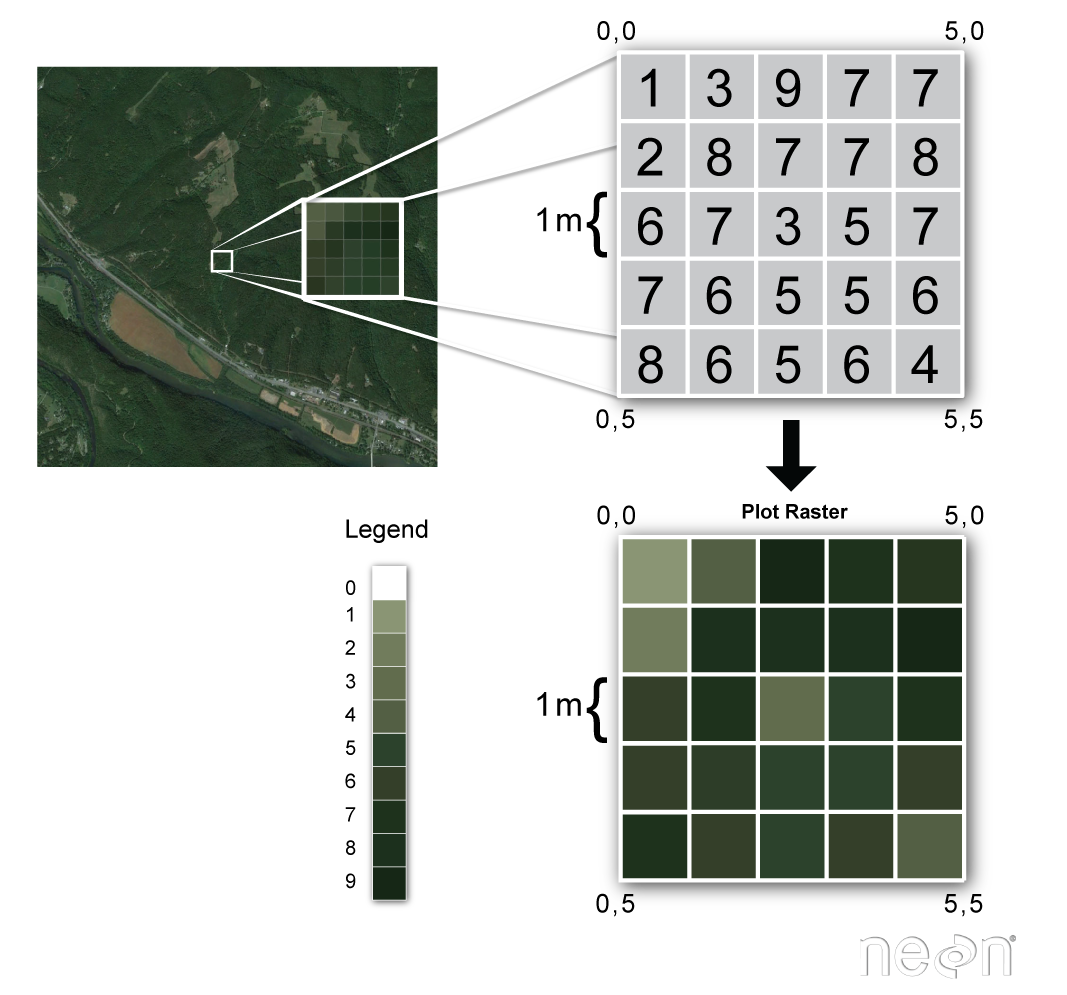
Raster data can have attributes associated with them as well. For instance in a LiDAR-derived digital elevation model (DEM), each cell might represent a particular elevation value. In a LIDAR-derived intensity image, each cell represents a LIDAR intensity value.
LiDAR Related Metadata
In short, when you go to download LiDAR data the first question you should ask is what format the data are in. Are you downloading point clouds that you might have to process? Or rasters that are already processed for you. How do you know?
- Check out the metadata!
- Look at the file format - if you are downloading a .las file, then you are getting points. If it is .tif, then it is a post-processing raster file.
Create Useful Data Products from LiDAR Data
Classify LiDAR Point Clouds
LiDAR data points are vector data. LiDAR point clouds are useful because they tell us something about the heights of objects on the ground. However, how do we know whether a point reflected off of a tree, a bird, a building or the ground? In order to develop products like elevation models and canopy height models, we need to classify individual LiDAR points. We might classify LiDAR points into classes including:
- Ground
- Vegetation
- Buildings
LiDAR point cloud classification is often already done when you download LiDAR point clouds but just know that it’s not to be taken for granted! Programs such as lastools, fusion and terrascan are often used to perform this classification. Once the points are classified, they can be used to derive various LiDAR data products.
Create A Raster From LiDAR Point Clouds
There are different ways to create a raster from LiDAR point clouds.
Point to Raster Methods - Basic Gridding
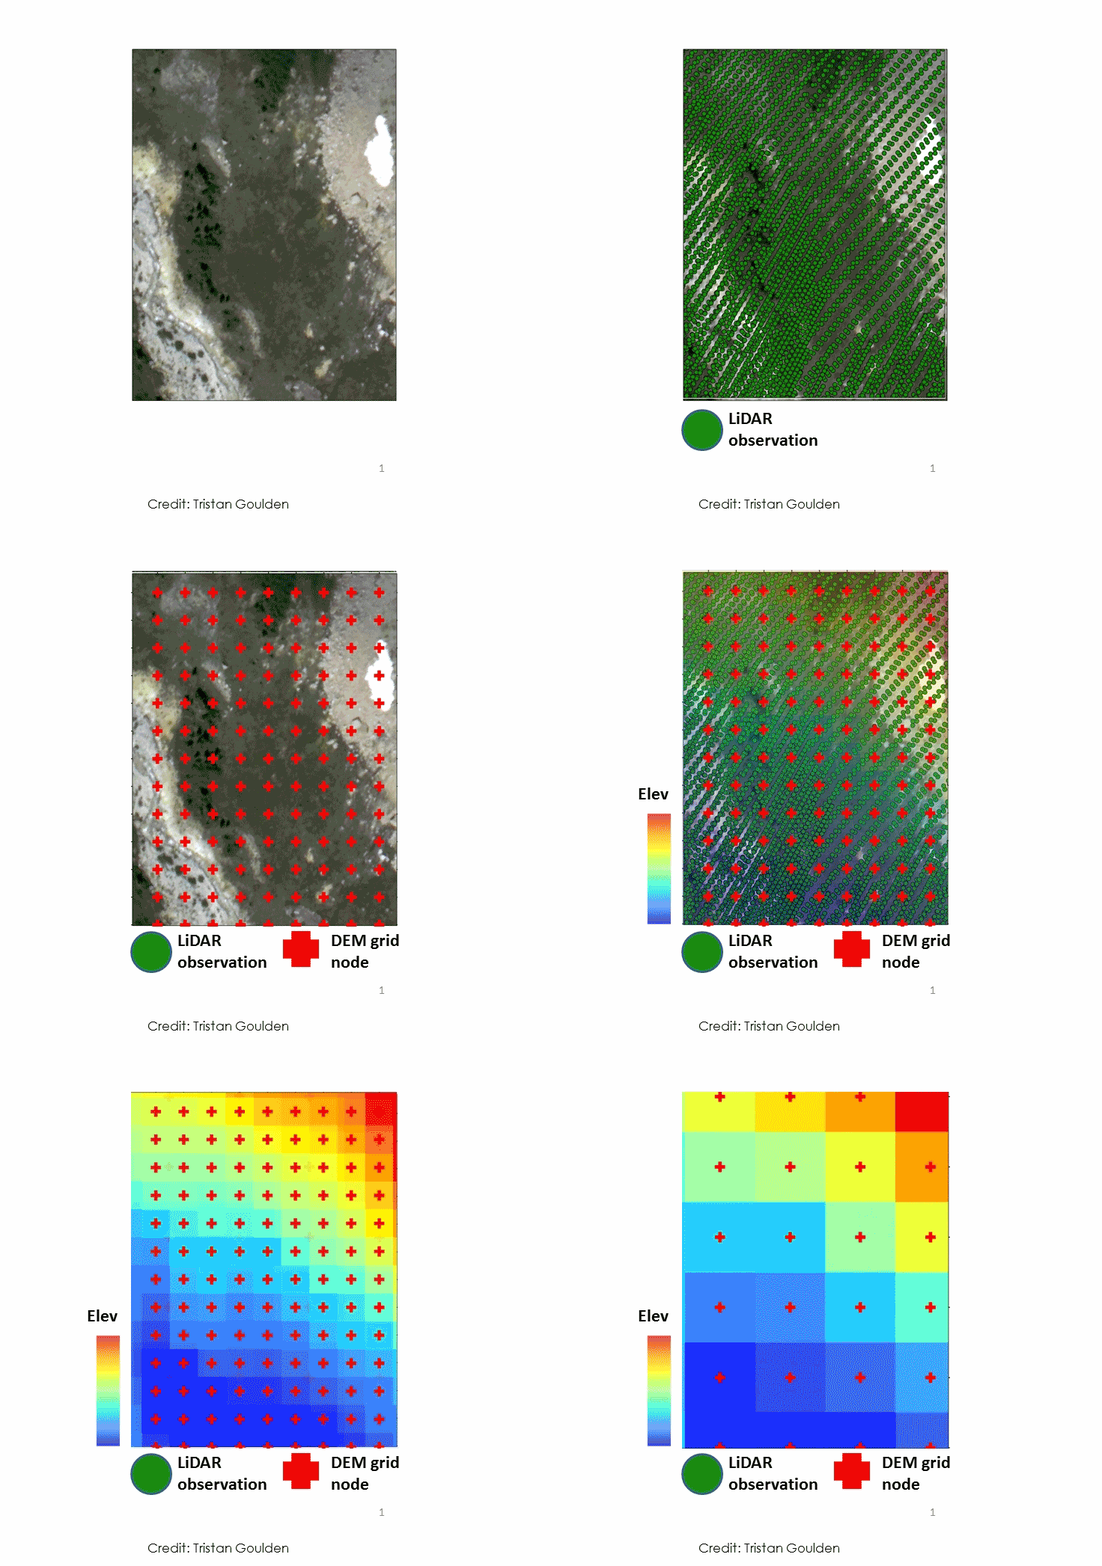
Let's look one of the most basic ways to create a raster file points - basic gridding. When you perform a gridding algorithm, you are simply calculating a value, using point data, for each pixels in your raster dataset.
- To begin, a grid is placed on top of the LiDAR data in space. Each cell in the grid has the same spatial dimensions. These dimensions represent that particular area on the ground. If we want to derive a 1 m resolution raster from the LiDAR data, we overlay a 1m by 1m grid over the LiDAR data points.
- Within each 1m x 1m cell, we calculate a value to be applied to that cell, using the LiDAR points found within that cell. The simplest method of doing this is to take the max, min or mean height value of all lidar points found within the 1m cell. If we use this approach, we might have cells in the raster that don't contains any lidar points. These cells will have a "no data" value if we process our raster in this way.
Point to Raster Methods - Interpolation
A different approach is to interpolate the value for each cell.
- In this approach we still start with placing the grid on top of the LiDAR data in space.
- Interpolation considers the values of points outside of the cell in addition to points within the cell to calculate a value. Interpolation is useful because it can provide us with some ability to predict or calculate cell values in areas where there are no data (or no points). And to quantify the error associated with those predictions which is useful to know, if you are doing research.
For learning more on how to work with LiDAR and Raster data more generally in R, please refer to the Data Carpentry's Introduction to Geospatial Raster and Vector Data with R lessons.