Tutorial
Introduction to AOP Public Datasets in Google Earth Engine (GEE)
Authors: Bridget Hass, John Musinsky
Last Updated: Jun 27, 2025
NEON AOP Data in Google Earth Engine
Google Earth Engine (GEE) is a free and powerful cloud-computing platform for carrying out remote sensing and geospatial data analysis. In this tutorial, we introduce you to the NEON AOP datasets that have been added to Google Earth Engine as Publisher Datasets.

NEON is planning to add the full archive of AOP L3 Surface Bidirectional Reflectance, LiDAR Elevation, Ecosystem Structure, and High-resolution orthorectified camera imagery. Since the L3 Surface Directional Reflectance is being replaced by the bidirectional (Bidirectional Reflectance Distribution Function (BRDF) and topographic corrected) reflectance as that becomes available, we are only adding directional reflectance data to GEE upon request. As of July 2025, bidirectional data is only available for AOP data collected between 2022-2024, but re-processing of older AOP data (2013-2021) will begin in mid-2025. Please see the tutorial Introduction to Bidirectional Hyperspectral Reflectance Data in Python for more information on the differences between the directional and bidirectional reflectance data products.
It will take time for the full archive of AOP data to be added to GEE, but NEON has been ramping up data additions starting in Fall 2024. This tutorial shows you how to find which data are currently available. If there are certain NEON sites and years of data you would like to see added to Google Earth Engine sooner, use the NEON Contact Us form to request this, and include "Google Earth Engine Remote Sensing Data" in the text.
Objectives
After completing this activity, you will become familiar with:
- Google Earth Engine (GEE)
- NEON AOP Image Collections in GEE
And you will be able to:
- Write and run basic JavaScript code in the GEE Code Editor
- Discover which NEON AOP datasets are available in GEE
- Explore the NEON AOP GEE Image Collections
- Plot an RGB image of a reflectance dataset
- Compare bidirectional and directional reflectance datasets
Requirements
- A Google or gmail (@gmail.com) account.
- An Earth Engine account. You can sign up for an Earth Engine account here: https://earthengine.google.com/new_signup/. Click on "Register a Noncommercial or Commercial Cloud Project", and on the next promp select "Unpaid Usage" and select the Project Type to create a free non-commercial account. For more information, refer to Noncommercial Earth Engine.
- A Google Cloud Project. See Set up your Earth Engine enabled Cloud Project.
- A basic understanding of the GEE Code Editor and the GEE JavaScript API.
Additional Resources
If this is your first time using GEE, we recommend starting on the Google Developers website, and working through some of the introductory tutorials. The links below are good places to start.
AOP GEE Data Access
AOP has currently added a subset of AOP Level 3 (tiled) data products at over 50 NEON sites spanning 10 years on GEE (as of Jan 2025). The NEON data products that have been made available on GEE can be currently be found on the GEE Datasets page, if you search for "NEON" as follows:
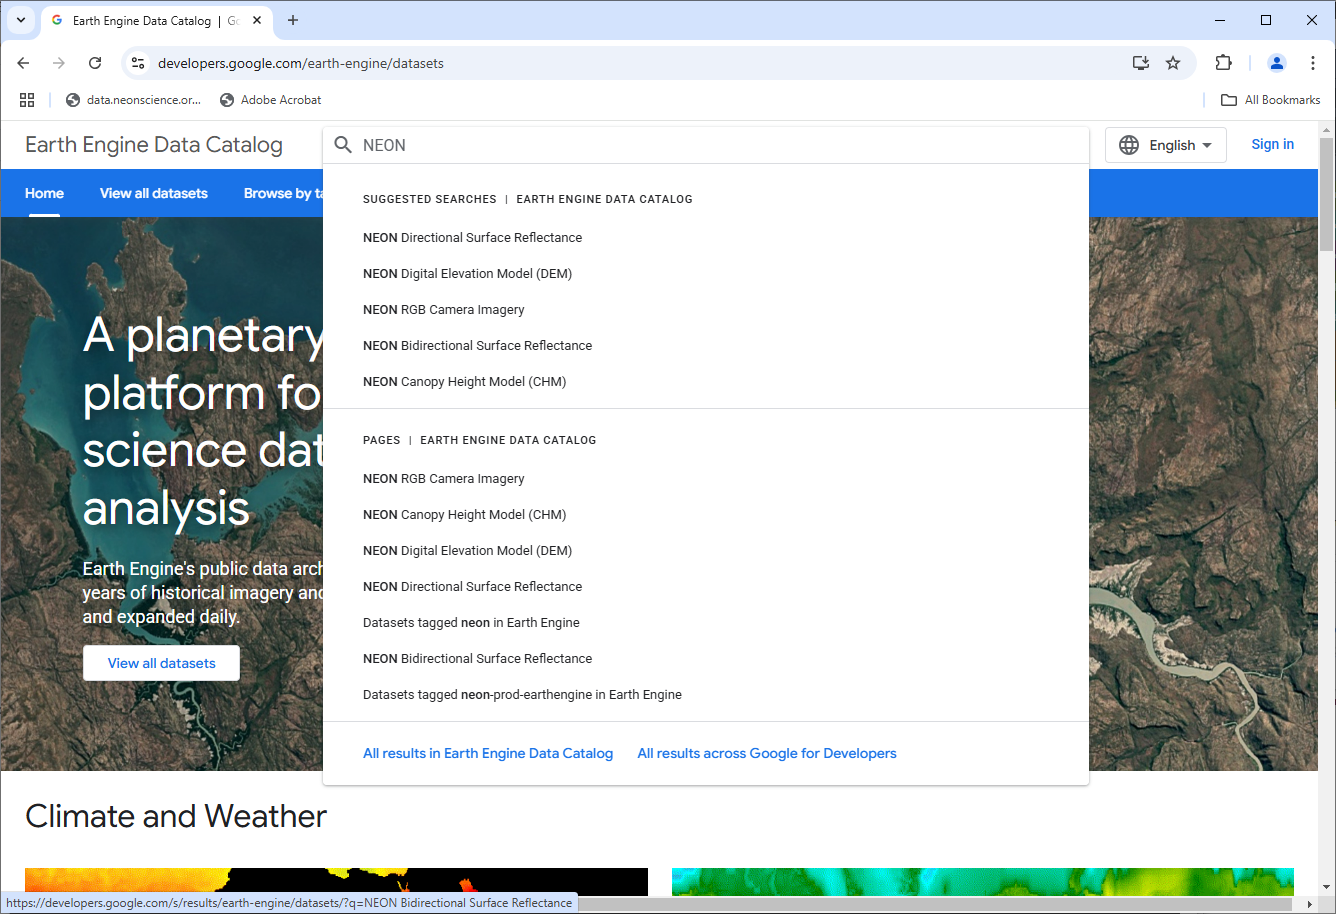
In the code editor, NEON datasets can be accessed through the projects/neon-prod-earthengine folder with an appended suffix of the Acronym and Revision Number, shown in the table below. For example, the Surface Directional Reflectance can be found under the path projects/neon-prod-earthengine/assets/HSI_REFL/001. The table below summarizes the GEE and NEON Data Portal IDs for each data product, and can be used as a reference for reading in AOP GEE datasets. You will learn how to access and read in these data products in the next part of this lesson.
| GEE Acronym/Revision | Data Product Name | Data Product ID |
|---|---|---|
| HSI_REFL/001 | Surface Directional Reflectance | DP3.30006.001 |
| HSI_REFL/002 | Surface Bidirectional Reflectance | DP3.30006.002 |
| RGB/001 | Red Green Blue (Camera Imagery) | DP3.30010.001 |
| DEM/001 | Digital Elevation Model (DSM/DTM) | DP3.30024.001 |
| CHM/001 | Ecosystem Structure (Canopy Height Model; CHM) | DP3.30015.001 |
Get Started with Google Earth Engine
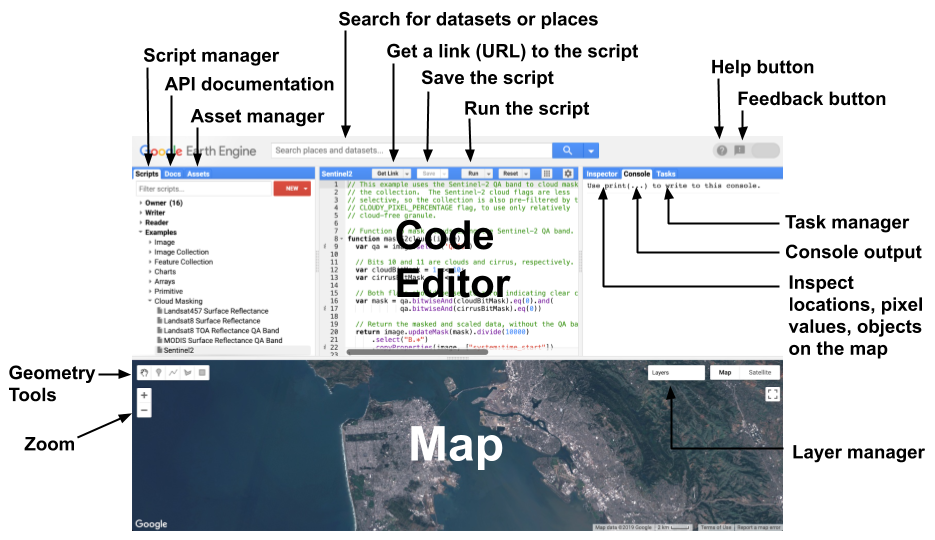
Once you have set up your Google Earth Engine account you can navigate to the Earth Engine Code Editor. The diagram below, from the Earth-Engine Playground, shows the main components of the code editor. If you have used other programming languages such as R, Python, or Matlab, this should look fairly similar to other Integrated Development Environments (IDEs) you may have worked with. The main difference is that this has an interactive map at the bottom, similar to Google Maps and Google Earth. We encourage you to play around with the interactive map, or explore the ee documentation, linked above, to gain familiarity with the various features.
Read AOP Data Collections into GEE
AOP data can currently be accessed through GEE through the projects/neon-prod-earthengine/assets/ folder. In the remainder of this lesson, we will look at the five available AOP datasets, or ImageCollections.
An ImageCollection is simply a group of images. To find publicly available datasets (primarily satellite data), you can explore the Earth Engine Data Catalog. The following steps will walk you through how to read in AOP Image Collections in the Code Editor.
In your code editor, copy and run the following lines of code to create 5 ImageCollection variables containing the Surface Directional Reflectance (HSI_REFL/001), Surface Bidirectional Reflectance (HSI_REFL/002), Camera Imagery (RGB), Canopy Height Model (CHM), and Digital Elevation Model (DEM) raster data sets.
//read in the AOP image collections as variables

var refl001 = ee.ImageCollection('projects/neon-prod-earthengine/assets/HSI_REFL/001')

var refl002 = ee.ImageCollection('projects/neon-prod-earthengine/assets/HSI_REFL/002')

var rgb = ee.ImageCollection('projects/neon-prod-earthengine/assets/RGB/001')

var chm = ee.ImageCollection('projects/neon-prod-earthengine/assets/CHM/001')

var dem = ee.ImageCollection('projects/neon-prod-earthengine/assets/DEM/001')
A few tips for the working in the Code Editor:
- In the left panel of the code editor, there is a Docs tab which includes API documentation on built in functions, showing the expected input arguments. We encourage you to refer to this documentation, as well as the GEE JavaScript Tutorial to familiarize yourself with GEE and the JavaScript programming language.
- If you have an error in your code, a red error message will show up in the Console (in the right panel), which tells you the line that failed.
- Save your code frequently! If you try to leave your code while it is unsaved, you will be prompted that there are unsaved changes in the editor.
When you Run the code above (by clicking on the Run above the code editor), you will notice that the lines of code become underlined in red, the same as you would see for a spelling error in most text editors. If you hover over each of the lines of codes, you will see a message pop up that prompts you to Convert the variable into an import record.

If you click Convert, the line of code will disappear and the variable will be imported into your session directly, and will show up at the top of the code editor. Go ahead and convert the variables for all three lines of code, so you should see the following. Tip: if you type Ctrl-z, you can re-generate the line of code, and the variable will still show up in the imported variables at the top of the editor. It is recommended to retain the code that reads in each variable, for reproducibility. If you don't do this, and wish to share this code with someone else, or run the code outside of your current code editor, the imported variables will not be saved and any subsequent code referring to this variable will result in an error message.

Note that each of these imported variables can now be expanded, using the arrow to the left of each. These variables now show associated information including type, id, and version.
Information about the image collections can also be found in a slightly more user-friendly format if you click on the blue link, eg. projects/neon-prod-earthengine/CHM/001. Below we'll show the window that pops-up when you click on the CHM link. We encourage you to explore all of the AOP datasets similarly. Note: You can also search for the NEON AOP image collections through the search bar on the Earth Engine Data Catalog webpage. The dataset page also contains all the information about the data product, eg. NEON Canopy Height Model (CHM).
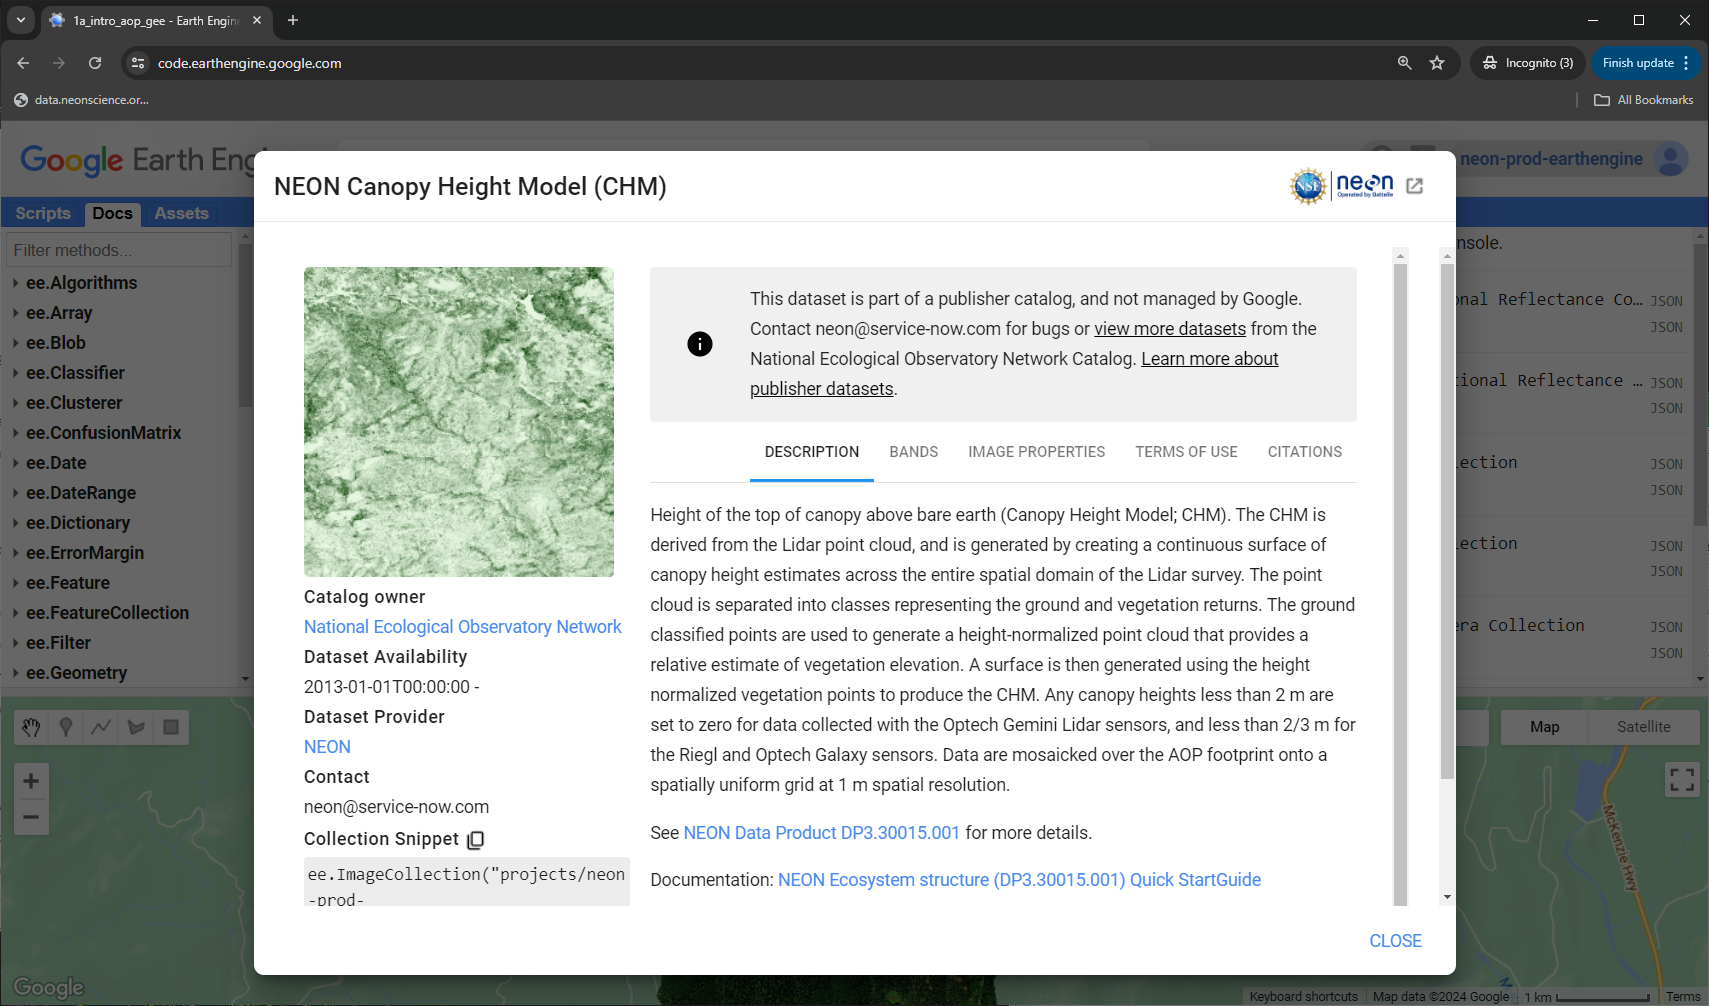
The end of the description includes a link to the Data Product landing page on the NEON Data Portal, as well as the Quick Start Guide, which includes links to all the documentation pertaining to this NEON data product, including the Algorithm Theoretical Basis Documents (ATBDs). Click on the other tabs to explore more about this data product. These tabs include DESCRIPTION, BANDS, IMAGE PROPERTIES, TERMS OF USE, AND CITATIONS.
TIP: You can also search for NEON data products through Code Editor by typing "NEON" in the search bar as shown below:

AOP GEE Data Availability
Since we are adding AOP data to GEE on a rolling basis, the first thing you may want to do after reading in the image collections is to determine which datasets are currently available on GEE. A quick way to do this is shown below:
// list all available images in the NEON Surface Directional Reflectance Image Collection:
print('NEON Images in the Directional Reflectance Collection',
      refl001.aggregate_array('system:index'))

// list all available images in the NEON Surface Bidirectional Reflectance Image Collection:
print('NEON Images in the Bidirectional Reflectance Collection',
      refl002.aggregate_array('system:index'))

// list all available images in the NEON DEM image collection:
print('NEON Images in the DEM Collection',
      dem.aggregate_array('system:index'))

// list all available images in the NEON CHM image collection:
print('NEON Images in the CHM Collection',
      chm.aggregate_array('system:index'))

// list all available images in the NEON CHM image collection:
print('NEON Images in the RGB Camera Collection',
      rgb.aggregate_array('system:index'))
In the Console tab to the right of the code, you will see a list of all available images. Expand each List to see the data available for each Image Collection. The names of the all the images follow the format YEAR_SITE_#, so you can identify the site and year of data this way. The number at the end is the Visit #; AOP typically visits each site 3 out of every 5 years, so the visit number indicates the cumulative number of times AOP has visited that site. Occasionally, AOP may re-visit a site twice in the same year.

Filter by Image Properties
Next, we can explore some filtering options to pull out individual images from an Image Collection. In the example shown below, we can filter by the date (.filterDate) by providing a date range, and filter by other properties, such as the NEON site code, using .filterMetadata. For this example we'll pull in an image from the NEON site Lyndon B. Johnson National Grassland NEON (CLBJ).
// read in a single reflectance image at the NEON site CLBJ in 2021
var refl001_CLBJ_2021 = refl001
  .filterDate('2021-01-01', '2021-12-31') // filter by date - 2021
  .filterMetadata('NEON_SITE', 'equals', 'CLBJ') // filter by site
  .first(); // select the first one to pull out a single image
Explore Image Properties
Next let's take a look at the Image Properties.
// look at the image properties
var clbj2021_refl_properties = refl001_CLBJ_2021.toDictionary()
print('CLBJ 2021 Directional Reflectance Properties:', clbj2021_refl_properties)
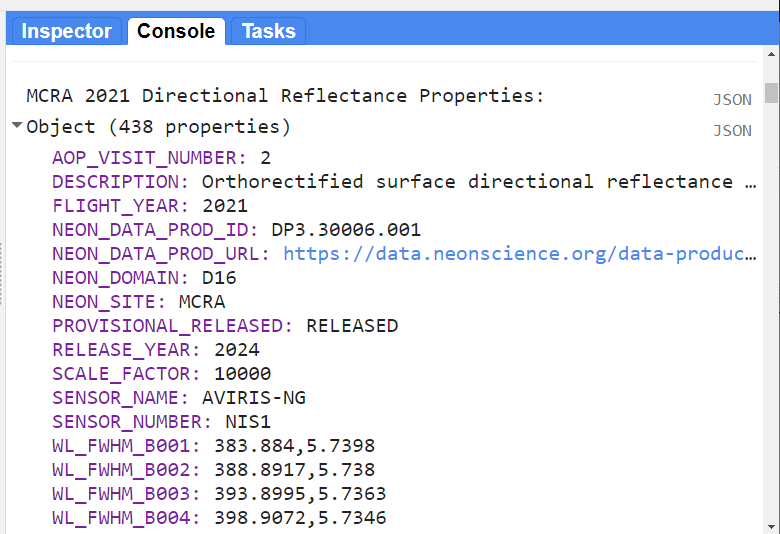
Look in the Console for the properties, you can expand by clicking on the arrow to the left of the Object (438 properties). Here you can see some metadata about this image. Scroll down and you'll get to a number of properties starting with WL_FWHM_B###. These are the WaveLength (WL) and Full Width Half Max (FWHM) values, in nanometers, corresponding to each band (Bands 001 - 426). You may wish to refer to this wavelength information to determine which bands you wish to display, eg. if you want to show a false color image instead of a true color (RGB) image. For a full description of what each of the Image Properties mean, you can look at the IMAGE PROPERTIES tab as explained in the previous section, or find it in the Earth Engine Data Catalog.
Determine Release Tag Information
When working with NEON data, whether downloaded from the Data Portal or on GEE, we always recommend checking whether the data are Provisional or Released, and the release tag of the data. On GEE, this information is included in the image properties PROVISIONAL_RELEASED and RELEASE_YEAR. If the data is released, the property RELEASE_YEAR will display the year of the release. The code chunk below shows how to display the release information for the CLBJ 2021 directional reflectance data.
// determine the release information for this image
var clbj2021_release_status = clbj2021_refl_properties.select(['PROVISIONAL_RELEASED']);
print('CLBJ 2021 Directional Reflectance Release Status:', clbj2021_release_status)

var clbj2021_release_year = clbj2021_refl_properties.select(['RELEASE_YEAR']);
print('CLBJ 2021 Directional Reflectance Release Year:', clbj2021_release_year)
In this example, the data is part of RELEASE-2024.
For more information on NEON releases, refer to the NEON Data Product Revisions and Releases page. There is a short period each year in January where AOP data on the NEON Data Portal may be in flux in preparation for an upcoming data release (typically end of January). GEE datasets are planned to be kept up to date with the current release, however there may be a lag period between the annual release and data updates on GEE. Data on GEE should be updated to match the current release by the end of February each year. For current information around the release status and data quality issue notices, you can follow NEON Data Notifications.
Plot a True Color Image
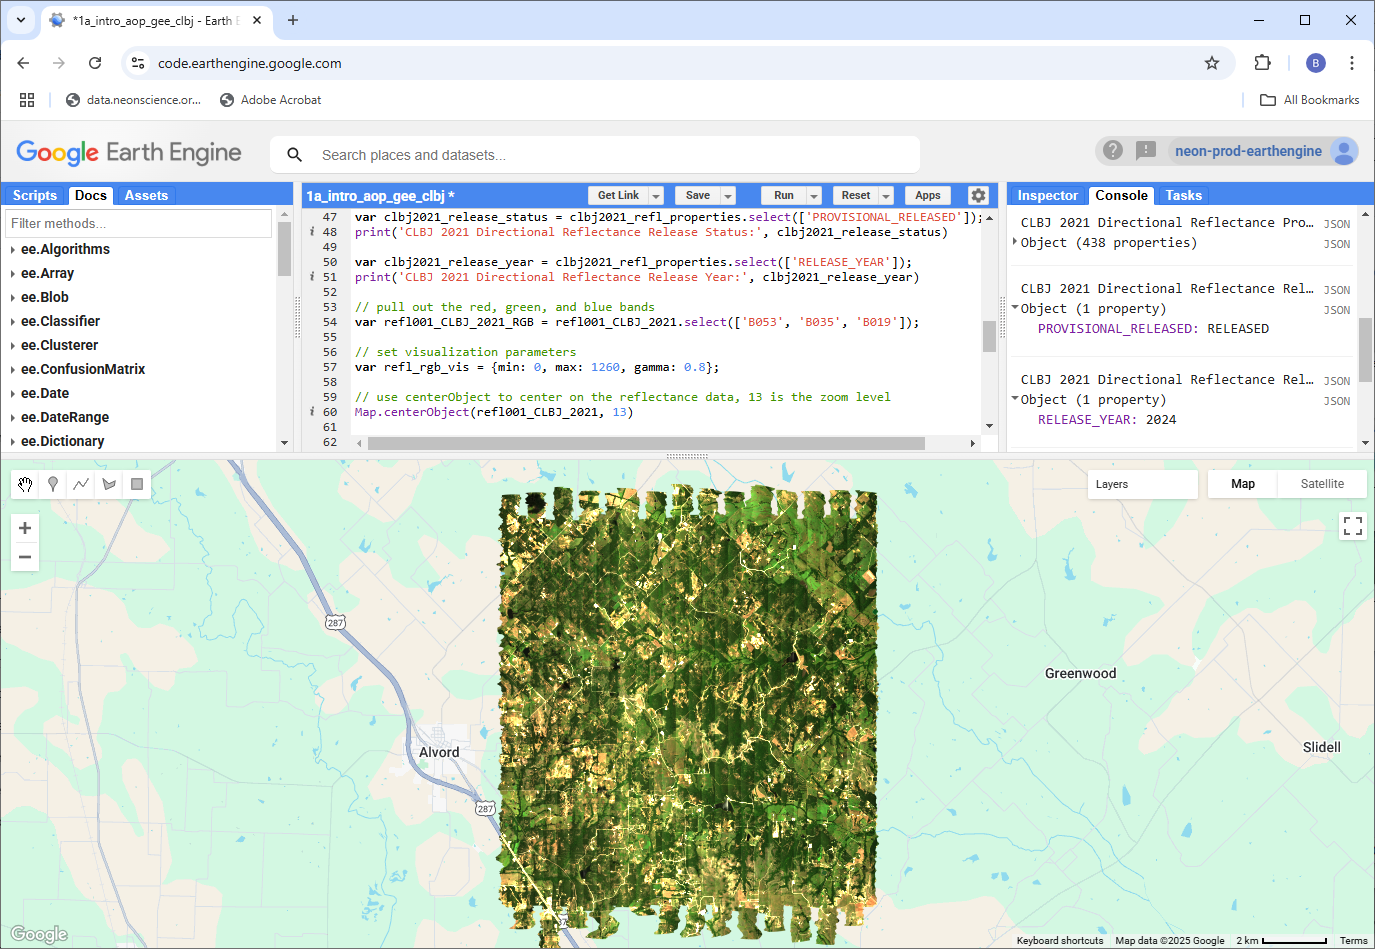
Finally, let's plot a true color image (red-green-blue or RGB composite) of the reflectance data that we've read into the variable refl001_CBLJ_2021. To do this, first we pull out the RGB bands, set visualization parameters, center the map over the site, and then add the map using Map.addLayer. There are a couple ways you can center the Map to the location you want. One is to use Map.centerObject and you can provide the image you want to center; otherwise you can specify the latitude and longitude, shown commented-out in the code chunk below.
// pull out the red, green, and blue bands
var refl001_CLBJ_2021_RGB = refl001_CLBJ_2021.select(['B053', 'B035', 'B019']);

// set visualization parameters
var refl_rgb_vis = {min: 0, max: 1260, gamma: 0.8};

// use centerObject to center on the reflectance data, 13 is the zoom level
Map.centerObject(refl001_CLBJ_2021, 13)

// alternatively you could specify the lat / lon of the site, set zoom to 13
// you can find the field site lat/lon here https://www.neonscience.org/field-sites/clbj
// Map.setCenter(-97.57, 33.40, 13);

// add this RGB layer to the Map and give it a title
Map.addLayer(refl001_CLBJ_2021_RGB, refl_rgb_vis, 'CLBJ 2021 Directional Reflectance RGB');
When you run the code you should now see the true color image on the map! You can zoom in and out and explore some of the other interactive options on your own.
Compare Directional and Bidirectional Reflectance
Lastly, let's also look at a bidirectional data product at the same site, and you can explore the differences between the directional and bidirectional reflectance. We will also display the release information for this data.
// read in a bidirectional reflectance image at the NEON site CLBJ in 2022
var refl002_CLBJ_2022 = refl002
  .filterDate('2022-01-01', '2022-12-31') // filter by date - 2022
  .filterMetadata('NEON_SITE', 'equals', 'CLBJ') // filter by site
  .first(); // select the first one to pull out a single image

// read the properties into a variable
var clbj2022_refl_properties = refl002_CLBJ_2022.toDictionary()

// determine the release information for this BRDF-corrected image
var clbj2022_release_status = clbj2022_refl_properties.select(['PROVISIONAL_RELEASED']);
print('CLBJ 2022 Bidirectional Reflectance Release Status:', clbj2022_release_status)

// if you try to read in the release year, it will throw an error
// since this data product is still PROVISIONAL, there is no release year
// comment out these lines below to remove
var clbj2022_release_year = clbj2022_refl_properties.select(['RELEASE_YEAR']);
print('CLBJ 2022 Bidirectional Reflectance Release Year:', clbj2022_release_year)

// pull out the red, green, and blue bands
var refl002_CLBJ_2022_RGB = refl002_CLBJ_2022.select(['B053', 'B035', 'B019']);

// add this RGB layer to the Map and give it a title
Map.addLayer(refl002_CLBJ_2022_RGB, refl_rgb_vis, 'CLBJ 2022 Bidirectional Reflectance RGB');
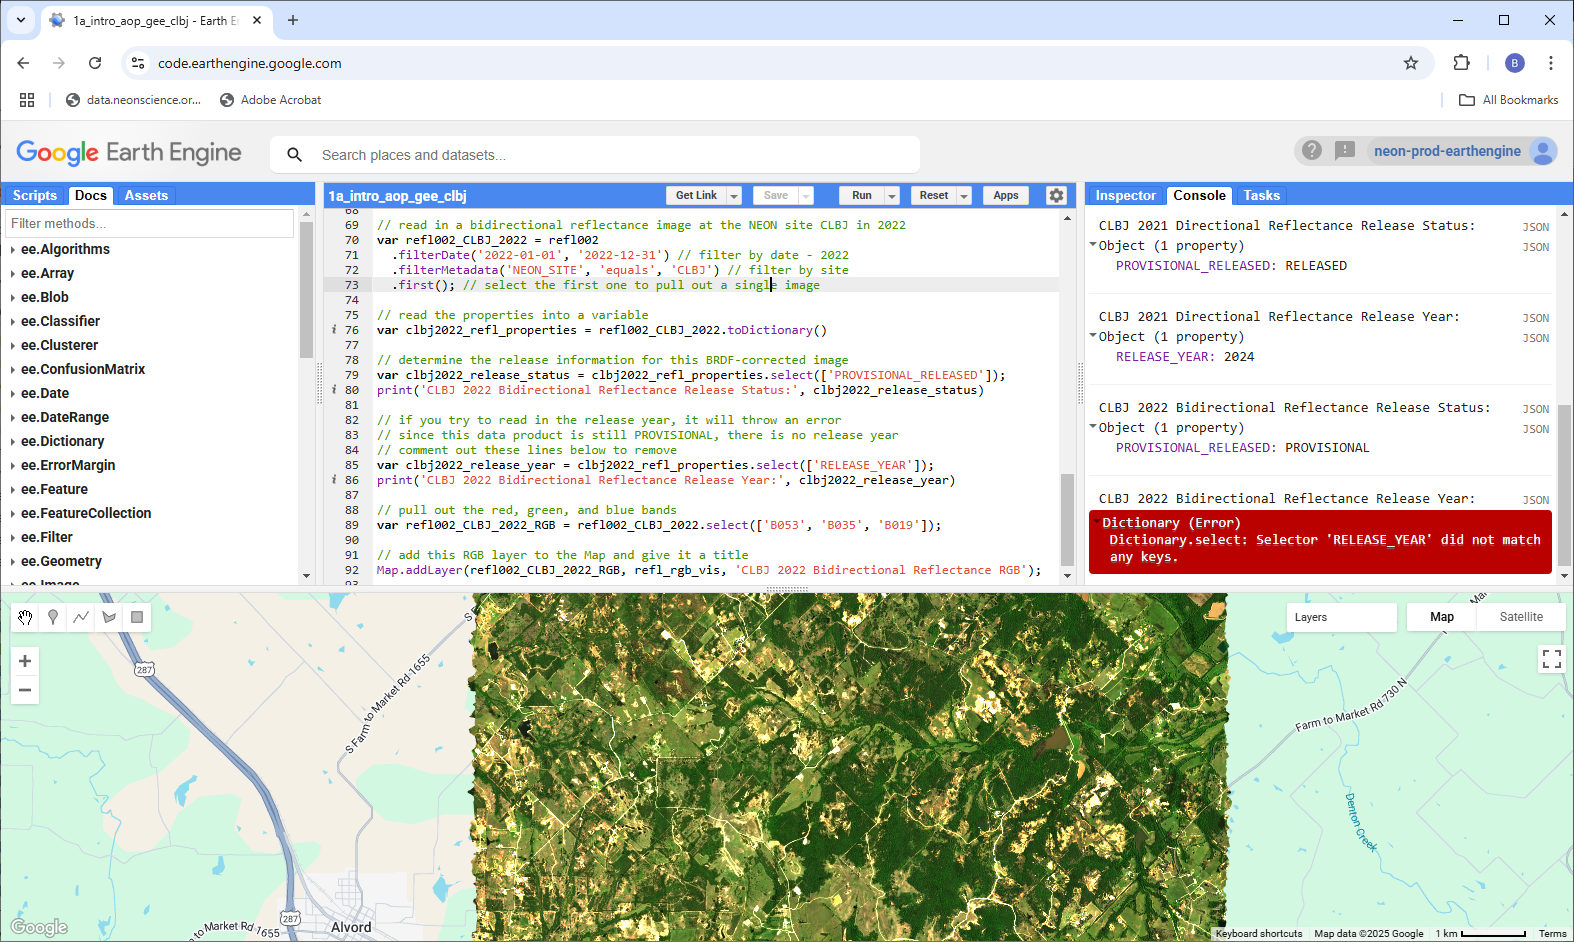
If your code has any errors they will display in the Console tab in red. In this example, we tried to print out a property that does not exist because the data is Provisional, so there is no RELEASE_YEAR. You can comment out the lines of code starting with var clbj2022_release_year to prevent the error from displaying. If your code is not running as expected, errors displayed in the Console can be helpful for troubleshooting, as it will tell you how and where your code failed. Print statements throughout the code can also be helpful.
Note that bidirectional reflectance data will remain provisional in 2025, since it is a new data product (as of 2024), and is planned to be incorporated into RELEASE-2026.
You can toggle between the two layers by selecting the "Layers" tab in the upper right corner of the Map window. Check and uncheck the two layers (2021 and 2022) to see the differences. You can also use the slider to the right of the layer name to make one layer partially transparent. What observations can you make about these two datasets?

The BRDF and topographic corrections typically visibly improve striping (or BRDF effects) between adjacent flightlines, as we can see with these datasets at CLBJ, where the 2022 bidirectional reflectance (left) looks much more seamless than the 2021 directional reflectance data (right), which has some visible vertical artifacts. For most NEON sites, the flight lines are oriented N-S so the stripes in the directional reflectance data will be vertical, but there are a few sites with slightly different flight plans.
A Quick Recap
You did it! You now have a basic understanding of the GEE Code Editor and its different components. You have also learned how to read a NEON AOP ImageCollection into a variable, import the variable into your session, and navigate through the ImageCollection Asset details to display information about the collection. You learned to read in an individual reflectance image, explore the image properties, and display a map of a true color image (RGB composite). And finally, you explored some of the differences between the directional and bidirectional (BRDF- and topographic corrected) reflectance data products at the site CLBJ.
It doesn't seem like we've done much so far, but this is a already great achievement! With just a few lines of code, you can import an entire AOP hyperspectral dataset, which in most other coding environments, is more involved. One of the major challenges to working with AOP reflectance data is its large data volume, which typically requires high-performance computing environments to read in the data, visualize, and analyze it. There are also limited open-source tools for working with hyperspectral data; many of the established software suites require proprietary (and often expensive) licenses. In this lesson, with minimal code, we have loaded spectral, lidar, and camera data covering an entire AOP site, and are ready to start exploring and analyzing the data in a free geospatial cloud-computing platform.