Data Quality
In order to test ideas about how ecosystems function or change over time, it is essential to obtain and use data that are fit for the intended analyses. Using good methodologies or well-designed instruments is important, but other measures must also be taken to ensure that data are fit for research.
This may include assuring (quality assurance) that:
- Sensors are correctly installed, collecting values in the correct range, and transmitting data correctly;
- Data entry is free of typographical errors or incorrect values; and
- Labs and technicians are using protocols or methods correctly and reporting errors.
It is also important to check data after collection (quality control) for issues such as:
- Unexpected gaps, such as can happen when a sensor isn't functioning or transmitting data properly;
- Values that are outside of a possible range;
- Processing errors, such as can happen when an incorrect calibration value or algorithm is applied to the data or a malfunction occurs with the processing system;
- Publication errors, such as writing the processed data into an incorrect format.
About NEON's data quality program
NEON is committed to delivering high-quality, research-grade data products to the ecological community. Our data quality program seeks to build and continuously improve quality assurance and control (QA/QC) methods throughout the entire lifecycle of our data. Quality assurance methods check data quality early on, during collection and ingest into our data system. Quality control methods are inserted at several points along our processing and publication chains (for more information about these, read the Data Processing & Publication page).
NEON's data QA/QC procedures continue to be refined and revised to incorporate lessons learned and community feedback. Input from the user community is both solicited and encouraged. Formal input is encouraged through our technical working groups, while informal feedback can be contributed at any time through our feedback page. Please see the Science Data Quality Plan for more detailed information.
Quality Program for Observation System Data Products
The data quality strategy for Observation System (OS) data includes four key tactics: (1) a robust training program for field staff, (2) controlling and validating data entry upon collection and ingest into the NEON database, (3) regular execution of custom, data product-specific quality checking routines after data ingest, and (4) an audit program for both laboratory and field data collection.
Controlling and validating data entry and ingest
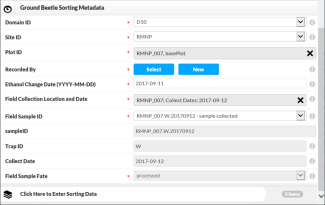
This is done initially through the development of mobile applications which can constrain data entry to correct data ranges by, for example, limiting the range of possible numeric values or limiting the choices for text-based values. NEON's data entry applications are developed using the platform provided by Fulcrum. The applications are designed to follow the workflow set out in each data collection protocol, with data entry constraints as documented in the entryValidationRulesForm (see below). Typical constraints include numeric thresholds; choice lists of valid values for specific fields, such as genus and species names; conditional validation, such as species lists restricted by location; auto-population of sample identifiers; and dynamic availability of fields and app subsections, depending on data entered.
Every download of an OS data product includes an associated Validation file, which contains the validation and automated creation rules applied to entry and ingest of the data in question. The rules appear in three columns in the Validation file: entryValidationRulesForm, entryValidationRulesParser, and parserToCreate. All three columns' rules are written in Nicl, the NEON Ingest Conversion Language.
entryValidationRulesForm
These are the rules implemented in the mobile data entry application for the data product. Some data products, and some tables within data products, are ingested by spreadsheet, in which case this column will be blank. Rules in this column are not machine-read, but interpreted by a human application developer, so may deviate slightly from strict Nicl. Violation of any of these rules prevents data from being saved or pops up a warning message that can be confirmed to allow the data to be saved. These rules are not an exhaustive list of the validations and constraints built into the data entry applications as some are too complicated to fit in a single cell.
entryValidationRulesParser
These are the rules applied by the OS Parser, the custom software that ingests OS data into the NEON database. Violation of any of these rules prevents data ingest. These are machine read.
parserToCreate
Instead of validating or rejecting data inputs, these rules are used to generate data for specific fields, based on other fields in the data. Most frequently these are either simple arithmetic or derivation of sample-related data. These are machine read.

In addition to controlled data entry, most OS data products include product-specific quality flags, and, where relevant, quality and uncertainty data from analytical laboratories. Many physical samples collected by NEON are analyzed by external laboratories, which are reviewed annually or biennially by the NEON Calibration and Validation team to ensure they are meeting agreed-upon standards of process and data quality. Laboratories typically provide per-sample data flagging, as well as long-term performance data for methods and instruments.
For products with an expanded data package option, quality information is generally in the expanded package. Details can be found in the Data Quality sections of the Quick Start Guide and Data Product User Guide for each product, available for download along with the data.
Legacy Data
NEON completed the last stages of construction in May 2019. A subset of data products collected during construction were not subjected to the current operational quality assurance and quality control procedures. For example, early observational data were collected using paper datasheets instead of mobile data entry applications, and are flagged as 'legacy data' in our data tables.
Quality checking routines after data ingest and publication
NEON scientists have crafted a set of QC scripts for each data product to perform further evaluation of data quality after collection and processing. The scripts analyze three aspects of data quality: completeness (e.g., expected number of records, expected fields populated), timeliness (e.g., sampling performed within the designated windows, samples processed within the appropriate time since collection), and plausibility (e.g., presence of outliers, consistency across time and with expected values).
These scripts have been used throughout NEON Operations to evaluate data quality, with continued improvement and refinement. When problems are found, there are a range of possible outcomes, including: editing data to fix resolvable data entry errors, adding post-hoc flagging or remarks to the data (applied only in limited circumstances), improving protocols and/or training materials, and updating data entry applications for improved front-end control. In most cases there is communication with field staff and/or contracted laboratories to understand the root cause of the data quality issues and develop solutions to prevent reoccurrence. In 2025, we expect to enable automated execution of these scripts on a monthly or quarterly basis, depending on the frequency of data ingest, so that issues can be identified and addressed more quickly.
Quality Program for Instrument System Data Products
NEON maintains thousands of sensors across the United States, mostly in wildland conditions. Errors in data are expected, but are largely mitigated, corrected, or flagged if need be due to a robust quality program. Quality assurance for the Instrument System (IS) is done through careful sensor placement and scheduled maintenance of the sensors and data loggers, as well as periodic calibration in controlled lab environments. Quality control is enabled through robust integration of both automated checking routines built into the data ingest and processing pipelines as well as periodic review by science staff (Sturtevant et al. 2022).
The majority of quality information for IS data can be found in the data product packages. Both the basic and expanded packages contain the same data variables, such as the mean, minimum, maximum, uncertainty, etc. over the aggregation interval (e.g., 30-minute). In addition to these data variables, the basic package typically contains a final quality flag, which aggregates the results of all quality control tests into a single indicator of whether the data point is considered trustworthy (0) or suspect (1).
The expanded package includes the final quality flag as well as quality metrics summarizing the results of each quality test over the aggregation interval. Three quality metrics per test convey the proportion of raw measurements that passed the test, failed the test, or whether the test could not be run (indeterminate). The results of all quality tests are aggregated into alpha and beta quality metrics, which respectively summarize the proportion of raw measurements that failed or were indeterminate for any of the applied quality tests (Smith et al. 2014). Using pre-determined thresholds, the alpha and beta quality metrics are used to compute the final quality flag. Details about the automated quality flags and metrics can be found in the Plausibility ATBD, De-spiking ATBD, and Quality Flags and Metrics ATBDs.

The Algorithm Theoretical Basis Document (ATBD) for each data product specifies which quality tests are applied, along with whether failure of each quality test results in removal of raw data prior to aggregating. The ATBD is available for download with each data product.
Computation of the final quality flag from the alpha and beta quality metrics can be overridden by the science review flag. If, after expert review, the data are determined to be suspect due to known adverse conditions not captured by automated flagging, the science review flag is raised (1), which in turn raises the final quality flag (1) regardless of its computed value. In extreme cases where the data are determined to be unusable for any foreseeable use case, the science review flag is set to 2, the final quality flag is set to 1, and the related data values are removed from the published dataset (although retained internally). The science review flag is included in the expanded download package, and the reason for raising the science review flag is documented in the data product issue log included in the download package's readme file.
Quality Program for Airborne Remote Sensing Data Products
The Airborne Observation Platform (AOP) payload consists of the NEON Imaging Spectrometer (NIS), waveform and discrete LiDAR, and a high-resolution digital camera and two Global Position system (GPS)/Inertial Measurement Units (IMUs). The GPS / IMU sensors provide high quality position and orientation information for the airborne trajectory which allows for a rigorous geolocation and high absolute and relative positioning between the sensors.
The quality of AOP data are highly dependent on proper payload operation, maintenance, and calibration. Each season the AOP sensors are lab assessed in the Sensor Test Facility, undergoing diagnostic tests to ensure the instruments are behaving correctly, as well as calibration to ensure inter-annual data consistency. With each flight campaign, pre and post calibration flights are performed in Boulder to ensure the calibration and geolocation of all instruments is acceptable. Throughout the flight season, the quality of the data are monitored through vicarious calibration targets and sensor self-diagnostic data streams. Results of lab-calibrations, or pre and post flight campaign calibration flights can be made available upon request.
For each flight, a series of L0 quality checks are performed to ensure the fidelity of the raw sensor streams. Once verified, the data are backed-up and a copy is shipped to NEON's long-term archival storage. After archive, NEON scientists process the data to higher level data products (L1+) which are delivered to the public. Throughout processing, several automated QA checks are performed to ensure the data meets NEON accuracy requirements. Automated L1+ QA/QC checks also generate data quality reports that are reviewed by Science staff and are distributed with the data. The QA reports also contain information on acquisition / processing parameters / calibration parameters used in data processing. The QA reports are the primary means for communicating AOP data quality to the public. Currently, seven reports are produced that include:
- QA of the SBET
- QA of the L1 processing of LiDAR data (point cloud)
- QA of the L1+ processing of discrete LiDAR data
- QA of the at-sensor radiance processing of the NIS data
- QA of the reflectance and L2 NIS products
- QA of the L3 reflectance and L3 NIS products
- QA of the processing of the waveform lidar
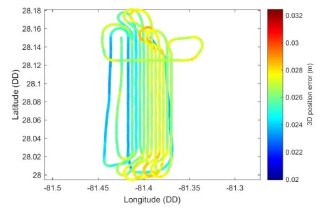
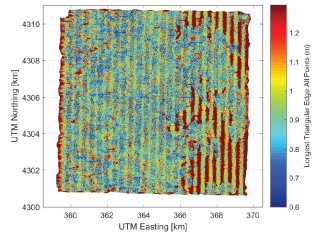
The following images show examples of the QA information that can be obtained from the QA reports. The first shows the airborne trajectory, colored by the estimated error in the position, the second shows the point spacing of acquired LiDAR points. Users are encouraged to explore the available QA documents which are currently delivered with relevant data product downloads.

