Correcting Land Cover Maps for NEON Field Sites
September 15, 2021
How does NEON ensure we are collecting data from many different ecosystem types and landscapes?
Soil and organismal sampling plots at NEON field sites are carefully selected to provide proportional representation for the different land cover types across the site. Making these decisions requires accurate information about what is actually on the ground. Recently, we reviewed and corrected land cover maps for five of our field sites using data collected by the NEON Airborne Observation Platform (AOP) and analyzed by NEON staff scientists. The new maps provide a more accurate view of land cover distribution at the sites and will be used to inform changes to our spatial sampling design.
Dave Barnett, a research scientist responsible for spatial sampling design for the NEON program, explains, "There are always tradeoffs to make when contemplating a change. There is a tension between the need for data continuity and the need to optimize the sampling design. But we have to get things right, so if something is not accurate, we have to correct that."
The Importance of Spatial Sampling Design at NEON Field Sites
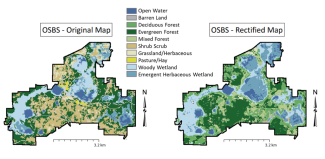
The spatial sampling strategy for the NEON program is designed to support high-level Observatory goals of understanding the causes and consequences of ecological change. The NEON terrestrial field sites represent a broad range of ecoclimate zones and land-use practices, from neotropical forests to midwestern pastureland. A single site may have multiple land cover types such as hardwood forests, wetlands, and open grassland. The NEON program uses land cover definitions and maps from the National Land Cover Dataset (NLCD). This map of Ordway-Swisher Biological Station (OSBS), part of Domain 03 (Southeast) in Florida, shows the many land cover types found across the site.

Ordway-Swisher Biological Station (OSBS) land cover map
NEON carefully selected soil and organismal sampling plots within each site using a spatially balanced, stratified, and randomized statistical design. The algorithm used in the selection process helps us allocate sampling efforts in proportion to the area of the NLCD classifications, which ensures efficient and accurate sampling of the variable land cover at each site. Randomization minimizes bias in the NEON spatial design and ensures that resulting data are robust to numerous analytical frameworks.
Occasionally, those plots have to be moved—either because something has changed to make them less suitable or because we have new information that changes our understanding of the landscape. For example, we may decide to move a plot to provide representation for a land cover type not currently represented or because it no longer represents the intended land cover type due to changes at the site.
Wait, That's Not a Forest! The Limits of the NLCD
The NLCD is created by a consortium of federal agencies led by the U.S. Geological Survey. The consortium generates land cover maps of the lower 48 states, Alaska, Hawaii, and Puerto Rico using Landsat satellite imagery and other supplemental datasets. This effort produces detailed land cover maps of the entire U.S. down to a 30-meter resolution. The NLCD defines 16 land cover types, such as deciduous forest, evergreen forest, mixed forest, shrub/scrub, grassland, pasture, cultivated crops, woody and herbaceous wetlands, and various stages of human development. Data are collected on a 5-year rotation to enable analysis of land cover changes across the U.S.
The NLCD maps are an extremely valuable resource at a continental scale and across decadal timescales. However, at local scales and over shorter timescales, discrepancies sometimes emerge between the NLCD maps and what is actually observed on the ground. The 30-meter resolution may miss the true heterogeneity of a landscape—for example, classifying an entire area as evergreen forest and missing tiny pockets of mixed forest or grassland. Rapidly changing ecosystems may also result in data discrepancies, especially if there has been a disturbance such as a wildfire or flood since the map was created. So occasionally, the plot-selecting algorithm may use erroneous data to define plot types, resulting in a site with the incorrect proportions of plots for each of the landcover types, or entirely missing a rare landcover type.
During the initial sampling design, the NEON field teams used ground-truthing to verify that the actual land cover on a plot matched the NLCD data used by the algorithm. Plots that didn't match the expected land cover type were eliminated and replaced with the next randomly selected plot in the algorithm. While most sites required only minor corrections, NEON researchers discovered more widespread discrepancies with the NLCD datasets at a handful of NEON sites. The NEON program needed a better way to verify and correct NLCD data at the site scale. Remote sensing data collected by the NEON AOP provided an answer.

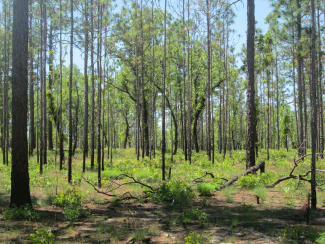
Forest at OSBS
Correcting Land Cover Maps Using AOP Data
The NEON Airborne Observation Platform (AOP) gathers airborne remote sensing data for most NEON terrestrial field sites annually at "peak greenness," the time of year when vegetation biomass and productivity are at their highest. (Note: some AOP flyovers were canceled or delayed in 2020 due to the COVID-19 pandemic.) The AOP's high-resolution (1 meter or less) photography and hyperspectral and lidar data, as compared to the 30-meter resolution provided by Landsat, provides researchers with a detailed picture of vegetation structure and even species composition at the plot level. Using the AOP, we can build maps that show the true heterogeneity of a site and exactly where the landscape shifts from one land cover type to the next.
In 2020, we used data from AOP to correct and update land cover maps at five NEON field sites. These maps were interpreted and verified by human experts to ensure accuracy. The process enabled correction of site-scale inconsistencies between what was observed on the ground and what was described in the original NLCD map as plots were being established. The five sites include:
- The Jones Center at Ichauway (JERC) – D03 (Southeast), Georgia
- Ordway-Swisher Biological Station (OSBS) – D03 (Southeast), Florida
- Guanica Forest (GUAN) – D04 (Atlantic Neotropical), Puerto Rico
- Treehaven (TREE) – D05 (Great Lakes), Wisconsin
- University of Kansas Field Station (UKFS) – D06 (Prairie Peninsula), Kansas
The updated maps provide a more accurate and up-to-date representation of land cover types across each site. As a result, the percentages of specific cover types at the sites were corrected, and areas that had previously been erroneously classified and thus not sampled could now be integrated in the spatial design. In some cases, this resulted in decisions to change the location of plots to capture the intended land cover type or adjust the percentage of plots within each land cover type. Spatial data includes versioning that shows when plots are created and retired. In other cases, the plot location was retained with an updated land cover description. For these sites, data files created before the land cover maps were corrected have been updated to reflect the correct land cover type.
How Changes to the NEON Spatial Design Are Made
The focus of this project was on correcting land cover maps that were wrong from the start, rather than updating maps for areas that have changed due to disturbances, land use changes or encroachment of different vegetation types. At this time, there are no plans to update land cover maps for the other terrestrial sites.
Making changes to the spatial design of the Observatory is not done lightly. All decisions are weighed carefully in collaboration with our Technical Working Groups (TWGs). Moving or eliminating a plot means losing continuity of data in a specific location over the lifetime of the Observatory. Sometimes, it is unavoidable—a plot may become inaccessible or dangerous to field technicians due to hazards such as dead standing trees from a wildfire or beetle kill or erosion on a steeply sloped plot. Sometimes, the questions are more complex. If the updated maps show that we have a land cover type that is not currently represented in our sampling design, do we add a new plot to ensure representation? What if the land cover type changes due to a disturbance—should we continue to sample the same plot to monitor the response or move the plot so we can continue to capture data for the intended land cover type? For example, some of the plots at our Great Smoky Mountain site were burned by wildfire, and what once was forestland is now thick with thornbushes. While monitoring the recovery period may be scientifically interesting, it is now nearly impossible to conduct sampling without the help of a machete—which, of course, damages what you are trying to measure.
These are exactly the types of questions that the TWGs are helping to answer. Barnett says, "The Technical Working Groups help us make some of these decisions. We will continue to work with our user community to make sure the changes we are making meet their needs."
