Case Study
Exploring Interrelationships Between Plant Biodiversity, Forest Structure, and Climate
October 18, 2021
Plant biodiversity is one of the key indicators of ecosystem health and productivity. It is also difficult to estimate at large scales. Forest structure has increasingly been recognized as a way to approximate patterns in the distribution of biodiversity. But how well do biodiversity-structure relationships hold up across climate zones?
A new study by Drs. Christopher R. Hakkenberg and Scott J. Goetz, recently published in Global Ecology and Biogeography, uses lidar and field observations from the NEON program to explore how climate mediates biodiversity-structure relationships (BSRs) across the United States. Their findings could help improve biodiversity maps created with remote sensing data and better predict the impact of habitat degradation and climate change on biodiversity across disparate regions.
Estimating Plant Biodiversity with Remote Sensing Data
In a diverse forest community, different kinds of plants—including trees, shrubs, vines, herbaceous plants, mosses, and lichens—fill different ecosystem niches. In turn, diverse plant communities support habitat for a broader range of animal species, including insects, mammals, and birds. Healthy biodiversity is correlated with many ecosystem services such as carbon storage potential, soil formation and protection, protection of water resources, and nutrient storage and recycling.

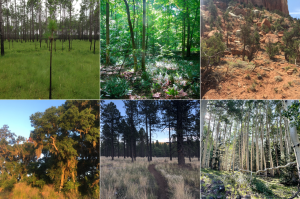
A fir and aspen forest in northern Arizona. Photo credit: Chris Hakkenberg.
Most biodiversity studies are small and localized because of the time and expense involved in getting humans to the field for detailed observations. This makes it difficult to get a true measure of biodiversity across larger landscapes and longer timescales. To truly understand the mechanisms driving biodiversity and how diversity may be changing over time, we need to be able to estimate plant biodiversity on a much larger scale than is feasible with field observations.

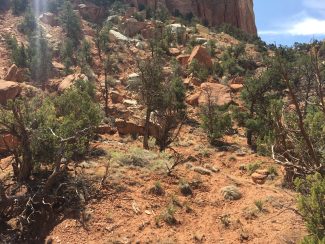
Juniper woodland in eastern Utah, near MOAB site. Photo credit: Chris Hakkenberg.
That's where remote sensing comes in. Lidar is a remote sensing technology that uses light to measure the structure of surface features, including vegetation. Using lidar, researchers can measure the height and density of vegetation on the ground from a specialized sensor carried by a satellite, airplane, or drone. Lidar provides a detailed 3D picture of vegetation structure over large land areas, from tens to hundreds of square kilometers. The NEON Airborne Observation Platform (AOP), which includes a lidar system along with an imaging spectrometer and a camera, takes measurements over forested NEON field sites at "peak greenness" each year.
Lidar remote sensing data can be used to estimate plant biodiversity. In many locations, the more complex the structure of a forested area—that is, the more variation in physical characteristics of vegetation across both horizontal and vertical planes—the greater the variety of plants you may expect to see. A tree farm consisting of rows of trees of the same age and species with a limited understory has a simple structure and consequently may have low biodiversity. A forest comprised of many different canopy tree species, a rich understory of shorter shrubs, and a variety of ferns, wildflowers, and other forbs at the base will have a more complex structure when viewed with lidar.
Looking at Biodiversity-Forest Structure Relationships Across Climate Zones
Hakkenberg and Goetz wanted to see how well biodiversity-structure relationships (BSRs) held up in different biomes across climate zones at a continental scale. Goetz is internationally recognized for his wide-ranging work on global ecosystem dynamics and leads Northern Arizona University's GEODE (Global Earth Observations of Ecosystems) Lab, which focuses on uses of remote sensing to study ecosystem structure and function. Hakkenberg is conducting postdoctoral research under Goetz at GEODE, building on his graduate work in biodiversity and community composition modeling using remote sensing data.

Mesic broadleaf forest in western North Carolina. Photo credit: Chris Hakkenberg
Hakkenberg explains, "Researchers are increasingly using airborne lidar to map and model plant biodiversity. But most studies relating forest structure and biodiversity have been conducted at small, localized scales. If we are going to start using remote sensing data to estimate biodiversity on a regional or continental extent, we need to know whether those relationships are valid at larger scales and how they vary between regions with different environmental and climate characteristics."

Oak forest with copious epiphytes in central Florida. Photo credit: Chris Hakkenberg.
Their study examines how climate variables—including average annual temperature, average annual precipitation, and the seasonal variability in temperature and precipitation—impact BSRs. They were particularly interested in looking at how climate stress, such as water availability and extreme temperatures, impact these relationships. Hakkenberg says, "If we look at biodiversity-structure relationships across regions, we see noticeable differences between, say, Washington state and Florida. But why should that be? What is driving those disparities? By quantifying how climate differs between regions, we can start to develop a three-way relationship between climate, biodiversity and forest structure that lets us explore how climate may be mediating the relationship between the other two."
The NEON program provided the data that they needed. They used remote sensing data and field observations from 29 forested NEON field sites across the continent. Lidar data from the NEON AOPs was used to estimate forest structure metrics such as canopy cover and mean height, canopy heterogeneity, canopy clumping, and height skew. This structural data was correlated with field data collected at sampling plots within each site, including species richness and diversity for both trees and all vascular plants. Climate data came from the Chelsa global dataset.
Hakkenberg explains that NEON's spatial sampling distribution is ideal for the type of analyses they wanted to perform. "We needed to be able to look at these relationships across a vast ecoclimatic space to see large-scale changes between ecoregions. The NEON program provides that, with sites distributed across the contiguous United States as well as Alaska, Hawai'i, and Puerto Rico. It would be hard to get data at that scale for North America without NEON," he says.
"Secondly," he continues, "the NEON program has a standardized design, which is incredibly important. We needed the field plot data and AOP instrument data to be consistent across sites to avoid problems due to inconsistencies between instruments and different sampling techniques that can introduce error when comparing data from different studies. With the NEON program, we can just concentrate on looking at the actual data instead of differences in instrumentation or sampling design."
The researchers also emphasize the value of the NEON program's multilayered hierarchal sampling design, with individual field plots nested within sites, which are grouped within Domains defined by ecoclimatic characteristics. "The statistical approach that the NEON program used in its spatial design enables us to look at cross-scale, macrosystem relationships across ecoclimatic gradients, and to be explicit in characterizing a specific local site in its broader ecological context."
Understanding the Biogeography of Plant Biodiversity
The study shows that different climate indicators have different impacts on biodiversity - forest structure relationships. Importantly, the relationships for trees differed from those for vascular plants as a whole, indicating that climate impacts how different plant growth forms compete for space and resources.
Water availability had a much larger influence on forest structure than temperature did in most regions. Where there is plenty of water, forests tend to develop with dense, closed canopies, regardless of average temperature. In more arid regions, forest canopies are patchier, with open areas interspersed with clumps of denser tree cover. Structure and temperature worked together, on the other hand, when it came to extreme coldness. Closed forest canopies in areas that experience extreme cold had higher plant diversity than forests in cold climates with sparser canopies, regardless of other climate variables. The researchers hypothesize that a dense, closed canopy may have a buffering effect in extreme cold, creating warmer microclimates within the canopy where diverse saplings and smaller herbaceous plants can survive.

Ponderosa pine forest in central Arizona. Photo credit: Chris Hakkenberg.
"The big takeaway here is that climatic context plays a substantial role in how forest structure relates to plant diversity," Hakkenberg summarizes. "A critical next step will be to integrate these large-scale findings with small-scale experiments to better understand the mechanisms driving these patterns. The better we understand the foundation of these relationships, the clearer the picture will be for how local and regional factors combine to influence the biogeography of plant diversity." He hopes that the study will likewise be a step towards building more accurate maps of plant biodiversity across the continent, and eventually the globe, using remote sensing lidar data.

Longleaf pine forest in Coastal Georgia. Photo credit: Chris Hakkenberg
Now, Hakkenberg is extending this work to the final frontier: space. He is working to create linkages between the NEON AOP lidar data and satellite lidar data collected by the NASA GEDI (Global Ecosystem Dynamics Investigation) program. He says, "You can't map biodiversity directly from space, but you can map forest structure with reasonably high precision. If we can characterize structure-diversity relationships across climate gradients, space-borne lidar data can be used to map and monitor plant diversity at unprecedented scales. Because we know forest structure and plant diversity are highly correlated with animal habitat, it can also be used as a proxy for biodiversity as a whole. Furthermore, we can use GEDI data to see how biodiversity is changing over time in response to changes in land use and climate."
Understanding how plant and animal biodiversity is changing has urgent implications for conservation, land management decisions, and public policy at local, national and international scales. "Remote sensing allows us to monitor biodiversity at scales simply not feasible with field methods alone," concludes Hakkenberg. "The better we understand the drivers of biodiversity, the better we can make management decisions and prioritize conservation efforts."


