Research Highlight
How a Tree’s Life can Change an Ecosystem: Plant Phenology, Gypsy Moths, and Heat Accumulation
November 20, 2019

By Karlee Bradley
Imagine walking through the deciduous forests in Massachusetts early one spring. It’s warm enough to enjoy the canopy full of green leaves, after branches have spent a whole winter as leafless sticks. Surrounded by the many oak and maple trees that provide shelter and food for the creatures in the forest, you’re already planning a trip back during the fall season—when the forests will change from green to the orange and gold colors of autumn. Thinking of how most of Massachusetts will look in the fall as you walk deeper into the quiet forest, you begin to hear a calming rain and start to feel raindrops falling down on you.
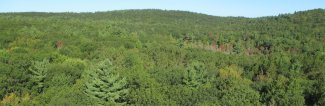
The view of Harvard Forest from the top of NEON's HARV meteorological/flux tower. Massachusetts.
As you wipe the raindrops off of your face, you look down at your hand and notice that instead of water, you wiped away dirt. Taking a closer look, it seems as though the dirt is actually bits of leaves that have been chewed. Looking up into the forest canopy, you now see the thousands of hairy caterpillars that are covering the trees and realize that the rain you hear and the dirt on your face is the excrement of these caterpillars from eating the leaves of the trees you stand under. These forest pests are the larvae of the gypsy moth.
The Gypsy Moth
Lymantria dispar, commonly known as the gypsy moth, is native to the forests of Europe and was first introduced into Massachusetts in the late 1800s. This invasive species has since spread as far west as Minnesota and as far south as North Carolina. The gypsy moth does not have many natural predators in the United States, contributing to this species’ ability to continue breeding and, ultimately, dominating where it inhabits.
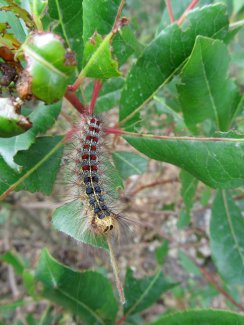
Gypsy moth caterpillar eating leaves
Gypsy moth caterpillars primarily feed on the leaves of deciduous broadleaf trees, and they have been known to completely defoliate groves of entire trees. When springs are more wet and experience a large amount of rainfall leaving trees hydrated and more resilient to destruction, gypsy moth populations are often kept under control due to a fungus called Entomophaga maimaiga which thrives in wet conditions. Known as the “caterpillar killer,” this fungus infects and kills gypsy moth larvae. However, when temperatures increase and precipitation regimes change over multiple years, leaving forests exposed to drought-like conditions, gypsy moth populations can also increase, and deciduous broadleaf trees can become more vulnerable to the damage of the larvae. For example, if springs are drier because of higher temperatures, the life cycle of Entomophaga maimaiga is impeded, allowing for higher populations of gypsy moths. With more gypsy moths, the defoliation damage to these drought-stricken trees is more severe, leaving them more susceptible to die after a serious defoliation event.
The consequences of severe deciduous broadleaf defoliation are wide-ranging. When particularly large numbers of leaves are consumed, the ecohydrology—interactions between water and ecological systems—and local weather in the area may be affected by the loss of the canopy. Less canopy coverage over water sources can lead to increased water temperatures which in turn encourage production of harmful algae blooms. This rapid growth of algae can lower the oxygen levels in the water creating domino effect within the aquatic food web.
Defoliation also disrupts the important nutrient cycles within a forest. Typically, leaves from deciduous broadleaf trees drop after they have changed colors in the fall, and these fallen, dead leaves supply a source of carbon to the microbes in the soil. These microbes decompose organic matter, are important regulators in the carbon cycle, and are necessary in maintaining nutrient balance within the soil. When gypsy moths defoliate forests in the spring, soil microbes receive caterpillar frass (excrement) rather than as fallen leaves in the fall. The quality of the organic carbon in frass differs from leaf organic matter, so not only are there differences in timing, there are also differences in the types of microbes that will consume the organic matter.
Small mammals, birds, and native insects that rely on these trees for food and shelter may also suffer from the loss of their food source and protection. With a destructed habitat, these animals’ survival is in jeopardy, and the stability of their food web is at risk.
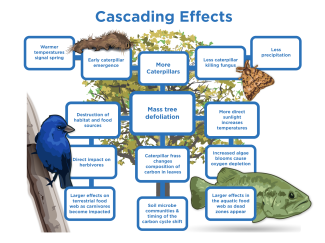
This diagram shows the effects that warmer temperatures and decreased precipitation can have on the gypsy moth and the deciduous broadleaf trees along with the consequences and interactions throughout the whole terrestrial and aquatic ecosystem. Image credit: National Ecological Observatory Network, Battelle.
Heat Accumulation and the Gypsy Moth
The gypsy moth depends on the accumulation of heat to transition between life stages, also known as phenological events. Researchers track this annual accumulation of heat as accumulated growing degree days (AGDDs), calculated using daily temperature data. Growing degree days (GDDs) are the number of degrees the average daily temperature exceeds the temperature below which the organism will remain developmentally inactive, also known as the base temperature. For land managers trying to control gypsy moth infestations, the most important phenological event to monitor in the gypsy moth is when eggs hatch and larvae start feeding. The timing of when eggs hatch and deciduous trees become in danger can be predicted using AGDDs.
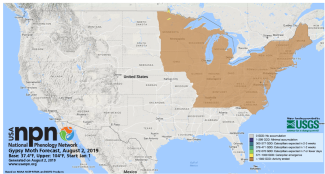
AGDDs for gypsy moth egg hatch are calculated using a base temperature of 37.4˚F and the double sine method. The National Phenology Network provides a gypsy moth forecast to predict when gypsy moth larvae are likely to emerge based on AGDDs.
Looking at heat accumulation in relation to gypsy moth development can help us better understand the relationships between these pests and the ecosystems they impact. Plants, like deciduous broadleaf trees, are also affected by heat accumulation, and the effects can be observed through their changing phenology. In fact, the deciduous trees that are so integral to ecosystem function often face even more threats than possible defoliation from gyspy months.
Heat Accumulation and Phenology of Deciduous Trees
While gypsy moth phenology tracks the insect from an egg to a larva (caterpillar) to a moth, plant phenology follows plants through plant phenophases, or observable stages of their life cycle that have a defined starting and ending point. Deciduous broadleaf trees have six main phenophases: breaking leaf buds, increasing leaf size, leaves, colored leaves, open flowers, and falling leaves. Like moths, plant phenology is also influenced by AGDDs because certain AGDD thresholds must be met before a transition from one phenological stage to another can occur.
With higher temperatures, GDDs accumulate more quickly, and plants progress through their phenophases more quickly as well. If warmer temperatures lead to spring-like conditions occurring earlier in what is called a “false spring”, flowering deciduous trees often transition into their freeze-intolerant open flowers phenophase before the risk of frost is over. While flowering trees will often survive a spring frost, the majority of their flowers often die resulting in no fruit production later in the season. A decrease in fruit production would disrupt the food web as herbivores that rely on this fruit must try to find food sources elsewhere.
Examining how plant phenology changes over time, especially in relation to temperature and heat accumulation, is important in: optimizing when to plant, fertilize, and harvest crops; managing invasive species, like the gypsy moth; predicting human health-related events like the timing and severity of allergies; understanding the timing of ecosystem processes, such as carbon-cycling; and assessing the vulnerability of species and ecological communities to ongoing climate change.
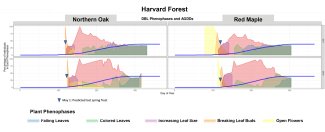
This data visualization shows both phenology data and Accumulated Growing Degree Days (AGDDs) at NEON’s Harvard Forest field site for 2017 and 2018. This field site is located in Massachusetts where according to the Farmer's almanac the average last frost date is May 1 (as calculated using the 1981-2010 US Climate Normals). As you can see, Red Maples in 2017 were flowering well before the last frost date making them more at risk to frost damage and the Northern Red Oaks were flowering after the last frost date. Shiny app source.
NEON Data and Exploring Patterns
Comparing AGDDs and changes in plant phenology can be achieved using available plant phenology data and daily temperature data, both of which can be obtained through the NEON Data Portal. NEON has been collecting data on plant phenology at NEON terrestrial sites across the United States since late 2013. Part of the monitoring follows deciduous broadleaf trees as they transform through their six phenophases. NEON employs status-based monitoring in which the phenological condition of an individual is reported any time that individual is observed. Status and intensity data are reported per phenophase per individual or patch, for each day observed. Air temperature data have also been collected each day since late 2013 at NEON field sites using sensor assemblies on deployed towers.
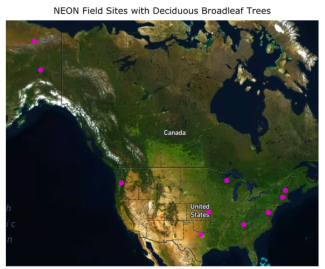
A map showing the geographic locations of NEON field sites with deciduous broadleaf trees.
The multi-year datasets below demonstrate the relationship between heat accumulation, in the form of AGDDs, and phenological transitions for deciduous broadleaf trees. In this interactive Shiny app, a user can select one of ten NEON terrestrial field sites where deciduous broadleaf tree phenology data are collected and choose to observe phenological transitions, AGDDs, or compare both together over time for a selected number of years that data are available for. The image below is a snapshot from the app.
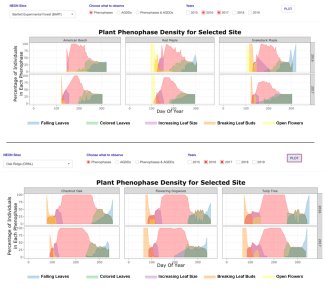
A comparison of phenology data at the Bartlett Experimental Forest and Oak Ridge National Lab field sites for the years 2016 and 2017. The data visualization makes it easier to explore how phenophases transition from year to year and how the transitions differ from site to site. Shiny app source.
Phenology is shown as the percentage of the observed individuals in each phenophase at each time point data was collected, and AGDDs are calculated using a base temperature of 50˚F—a standard base temperature for plant phenology—and with the temperature averaging method, where the calculation of GDDs follow this equation:
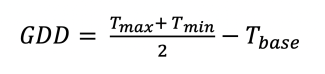
GDD=(Tmax+Tmin)2 - Tbase
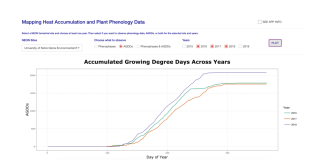
This data visualization shows Accumulated Growing Degree Days (AGDDs) at the UNDERC site for 2016, 2017, and 2018. Exploring how AGDDs may be changing from year to year can inform predictions of how phenology may change from year to year. Shiny app source.
These data allow users to explore the linkage between temperature and plant phenology, over time and across space. This could then serve as the basis for further studies regarding the impacts of shifting temperatures on ecosystems, including the relationship between temperature, plant phenology, and gypsy moth population dynamics.
Explore the interactive data visualization App
NEON will continue to collect phenology and air temperature data for the next 30 years, making it possible to monitor ongoing patterns and make predictions for future seasonal changes. These predictions can then help us in understanding interactions throughout parts of the food web and ecosystems that may be affected by changing climates.

NEON intern Karlee Bradley
Karlee Bradley, is a mathematics major at St. Edward’s University in Austin, TX. who participated in an eight-week internship at NEON in the summer of 2019, made possible by the Institute of Interdisciplinary Science at St. Edward’s.
During the internship, Karlee developed the Mapping Heat Accumulation and Plant Phenology Data Shiny App and researched and wrote this data story. Coming in, Karlee had very little previous R experience, but throughout her time at NEON, she gained the skills to create interactive data visualizations through Shiny with data from the NEON Data Portal. With a passion for spreading awareness about various social justice issues she’s learned about, Karlee wanted to create a human connection with this blog post so that readers and users can understand the importance of looking at data to explore our changing ecosystems.
Want to gain the same skills Karlee gained? Here are a few tutorial resources that she completed to create her shiny app:
