Reflections on remote sensing, ecology and the NEON AOP
June 15, 2012
By Leah Wasser
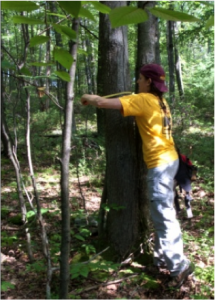
A few summers ago, I spent my time in the field hugging trees. While I’ve been called a hippie in the past, this was hardly hippie behavior. This was research. I was an ecology Ph.D. student studying streamside forests and measuring things like the diameter and canopy heights of trees. I trudged through countless miles of dense and sometimes thorny vegetation, up steep hills and across rocky terrain to find and measure trees. I saw countless black snakes and ticks and in one instance dodged a near head-on collision with a particularly confused and speedy adult version of Bambi (I am not kidding about the deer – it was a near-K.O. for me). To this day, the burrs from that summer are still embedded in my backpack. Keeping tabs on the health of trees is important, as trees do a lot of good things for and within the stream ecosystem. For example, they protect streams from harsh pollutants (such as fertilizers and road salts) in runoff from adjacent roads and buildings.

They shelter stream channels from the harsh sun, keeping water temperatures cool. They also provide birds and other wildlife with homes and food and provide us with clean drinking water and clean air. Ecologists like to call these functions that trees perform “ecosystem services,” or the services or functions that natural elements around us provide. These services maintain ecosystem health, which affects human health and well-being too. By the end of the summer, I had collected lots of information about the vegetation in my many plots scattered throughout my study watershed (which was big for one student to survey – spanning many hundred square miles). I could measure only so many trees myself as I was traveling through the forest on foot. However, I had a bigger plan to compare my measurements with data derived from a light detection and ranging (LiDAR) system mounted on an airplane. If the heights that I measured on the ground lined up with heights extracted from this LiDAR data, I could justify using those same methods to estimate forest vegetation cover throughout the entire watershed (instead of just within my plots). It’s not quite the same as sending a few hundred grad students like me out there on foot every summer to measure every tree in the forest, but it's as close as we can practically get.
NEON is doing something similar to what I did, but on a much larger scale. NEON is collecting data on the ground and from the air and looking for connections between those data sets and other existing remote sensing datasets (for example, satellite collected remote sensing data). The NEON project is making an incredible contribution to the worlds of remote sensing and ecology (and to anyone interested in the environment for that matter).
Remote sensing in ecology
You have used remote sensing data if you’ve ever looked at satellite or aerial images on a mapping website such as Google or Bing maps. Remote sensing data are all about the big picture – about tracking change in landscape conditions and measuring landscape level health and integrity over broad areas. Many ecologists collect detailed data within smaller areas, such as the plots that I sampled during my PhD work. We ecologists like to call this “field or in situ data.” In turn, we can use this information to estimate things like tree heights across a watershed, state, country or even across the globe. We can estimate changes in land cover and land use (trees, buildings, roads) over varying areas, and detect patterns in the atmosphere (e.g. changes in particle distribution or cloud cover).
Remote sensing sensors detect reflected energy from objects on the ground or in the atmosphere. Active remote sensing methods use both an emitter and a sensor. The emitter broadcasts energy waves, and a sensor records the energy as it returns from the Earth’s surface. Information about the returned energy, including the time it takes it to travel to an object and back, can be used to calculate the object’s location and elevation on the Earth’s surface. The intensity or amount of the energy returned can also be used to derive information about the object’s physical characteristics. If you’ve ever checked the weather radar, then you have used one type of active remote sensing data! The energy source in radar is radio waves, which reflect off of objects like clouds in their path. The NEON Airborne Observation Platform is collecting data using LiDAR, another type of active remote sensing. The energy source for airborne scanning LiDAR data is light emitted from a laser. A LiDAR instrument mounted on an airplane directs laser light at the Earth’s surface, and the LiDAR sensor records the light energy as it returns. This energy can in turn be measured to tell us more about objects on Earth. For example, the time it takes the light to bounce off an object and travel back to the sensor and the plane’s position in the sky can be used to derive an elevation for the object that produced that reflection. The intensity of light reflected from that object can also be used to characterize the surface type of the object. Not all LiDAR systems measure objects on the earth. Some measure atmospheric conditions including cloud cover.
Airborne LiDAR data can tell us SO MUCH about what is on the ground! For one, it can be used to generate high resolution elevation values and thus is used to create accurate elevation maps. These maps are commonly used for flood mapping, but also can be used for 3D mapping applications (this is an incredible field!) and to track changes in the landscape such as landslides and flooding. Within forested areas, LiDAR data can produce a 3D image of the canopy, which can in turn be used to estimate important forest metrics such as canopy height, species composition, canopy density, biomass, and more. High resolution LiDAR data have even been shown to detect individual tree stems! In addition to airborne LiDAR data, NEON is collecting airborne spectral remote sensing data. Spectral data are collected using passive remote sensing methods, which rely on an existing energy (which is most often the sun). Light from the sun is reflected off of the earth’s surface, from objects on the ground and particles in the atmosphere. Different objects reflect and absorb light energy in different ways, and the sensor records information about the reflected light that allows scientists to describe the objects that reflected the light.

One common use of passive remote sensing data is to measure vegetation health using spectral imagery. A regular image that you see on Google Maps is made up of three bands or “colors” – red, green and blue. These three colors, red, green, blue, make up visible light – i.e. what the human eye can see. In contrast, multi- (a few bands) and hyper- (lots of bands) spectral images provide information that is both within the visible spectrum and outside of it. Healthy vegetation is highly reflective in the near-infrared range of the light spectrum and thus can be easily detected within a multi-spectral image. The NEON AOP is collecting both regular imagery (which, like a photograph, represents the visible range of the light spectrum) and imagery that spans a range of light energy (visible through infrared parts of the light spectrum) which is an exciting prospect for vegetation scientists and ecologists alike.
NEON AOP calibration flights
I recently had the opportunity to help the NEON AOP crew with a data collection mission. Let me digress to say that they are an amazing bunch. AOP is currently in the process of calibrating their instruments using data collected on the ground. This calibration process includes making sure the data that they collect are accurate both spatially (i.e. measurements are recorded with accurate location information) and spectrally – (calibrated measurements take into account the impact of atmospheric conditions such as sunlight and cloud cover). NEON has been and is currently flying over varying sites with different sensor and flight settings to test how well the sensors are performing. If scientists wish to use NEON’s data, they need to be able to trust that the data are accurate! As I type this I am currently out at Ivanpah Playa – a dry lake bed in southeastern California near Las Vegas, Nev. that is a known RS data calibration site. I am helping the AOP team calibrate their spectrometer. It is hot - like 100 degrees plus out and so windy that you can lean into the wind back first and not fall. No joke! But yet, I couldn’t be more excited to be here. Want to know why? Stay tuned for my next post, coming soon. And who knows, maybe I’ll also have graduated from my lowly, tree hugging, Ph.D. student status by then as well.


